Manipulating the Temperature Data
CSS-55 Is the temperature data being manipulated? Absolutely, and that process is called homogenization. There are valid reasons for some adjustments (Time of Observation Bias (TOBS), Station Location changes, Equipment Changes/Upgrades, etc.), But the homogenizers have been taking huge liberties with the process in the relentless quest to maintain the alarmist (all CO2, all the time) narrative. Total adjustments in the United States Historical Climate Network (USHCN) weather station data have been adjusted by roughly 2 °F (just over 1 °C). Compare that to the IPCC’s official estimated 1.07 °C global temperature rise since the pre-industrial era (from their 2021 AR6 Report). Begs the question, how much of that temperature rise is due to “homogenization”? Obviously, the US is somewhat localized, but historically the US has accounted for a significant percentage of the globe’s weather stations (both in quantity and quality) and homogenization is not limited to the US.
#climatechange #delaythegreen #globalwarming #showusthedata
The majority of this post ties together five of Tony Heller’s many posts on temperature manipulation within the USHCN database. I have added my own thoughts on his images and finished with some general discussion on homogenization based on my own experience. The five videos are linked below and are well worth watching on their own. Tony weaves in historical news articles that show extreme weather events have been just as bad (or worse) in the past than anything we are currently experiencing globally. The empirical data analysis speaks for itself, but for those that dispute Tony’s presentations, please feel free to put forward a detailed alternative analysis.
Climate Misinformation
Real Climate Science
The Climate Data Corruption Business
Climate Data Corruption Business (Part 2)
US Climate Fakery
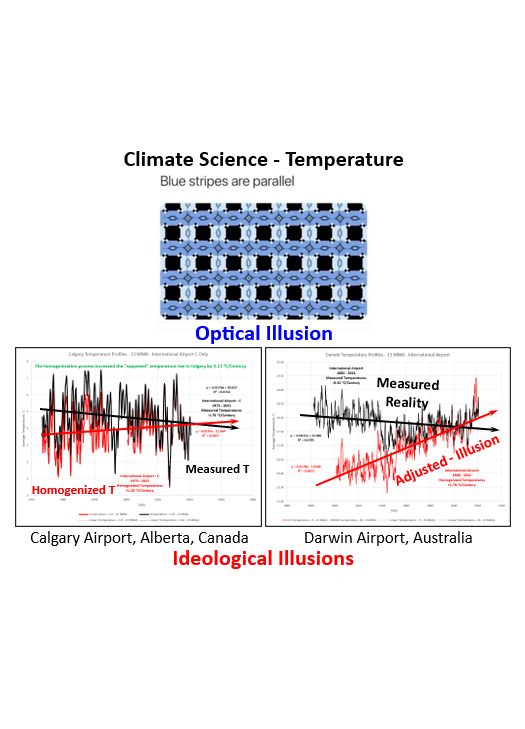
Data manipulation is rampant within the “Climate Science” community (with no meaningful quality control, apart from individuals like Tony Heller or Anthony Watts (from Watts Up With That and the Heartland Institute)). Most weather stations around the world have been subjected heavily to the homogenization process. Antarctica and Greenland would be the exception since they are for the most part research stations with minimal human influence. Anyone can easily review the data for your own locale or anywhere in the world (NASA-GISS Station Data). I had a detailed look at Calgary’s International Airport (CSS-19 – Calgary – Homogenization). The homogenization occurring in Calgary is ridiculous. Calgary’s measured temperatures have been declining at 1.76 °C/century since a second measuring system was commissioned in 1973. The homogenized (i.e.: official) temperatures are magically rising at 1.35 °C /century. Calgary’s temperatures have been adjusted by 3.11 °C /century and is an excellent example of how to turn a cooling trend (the reality) into a warming trend (the narrative). The data homogenizers obviously live by the mantra ‘Cool the Past, Warm the Present’ and ye shall produce Global Warming. I personally, experience measured temperatures not homogenized temperatures. I suspect the same goes for you.

The Safe Climate of 1921 – Tony Heller
CSS-36 – Solar Flares and CMEs

CSS-32 – UAH Temperature Analysis
CSS-39 – WMO – Global Warming Propaganda

Climate Data Corruption Business (Part 2)
The Measurement of Global Temperatures (appinsys,com)

Climate Data Corruption Business (Part 2)
State Climate Summaries 2022 – NCICS Report


US Climate Fakery – Tony Heller
CSS-40 – Satellite Temperature Comparisons
OPS-52 – Solar Activity – NOAA Forecast


CSS-8 – Earth Day 2021
CSS-52 – Extreme Weather Events
OPS-49 – Temperature Manipulation


CSS-23 – Greenland/Iceland – Homogenization
OPS-72 – Where Are Greenland Temperatures Headed?
Many thanks to Tony Heller for his perseverance and dedication to truth and common sense. For more perspective and more detailed analysis, you can also check out some of the following posts.
The Safe Climate of 1921 (Tony Heller)
NASA/GISS Station Data
https://data.giss.nasa.gov/gistemp/station_data_v4_globe
State Climate Summaries 2022 – NCICS
https://statesummaries.ncics.org
NOAA’s Climate At A Glance
https://www.ncei.noaa.gov/access/monitoring/climate-at-a-glance/national/time-series
One Page Summary (OPS)
OPS-49 – Temperature Manipulation
OPS-52 – NOAA – Solar Activity Forecast
OPS-72 – Where are Greenland’s Temperatures Headed?
Climate Short Story (CSS)
CSS-8 – Earth Day 2021
CSS-13 – A Look at Homogenization
CSS-19 – Calgary – Homogenization
CSS-23 – Greenland/Iceland Homogenization
CSS-32 – UAH Temperature Analysis
CSS-36 – Solar Flares and CMEs
CSS-39 – WMO – Global Warming Propaganda
CSS-40 – Satellite Temperature Comparisons
CSS-52 – Extreme Weather Events


