Building a Better, More Realistic Climate Model
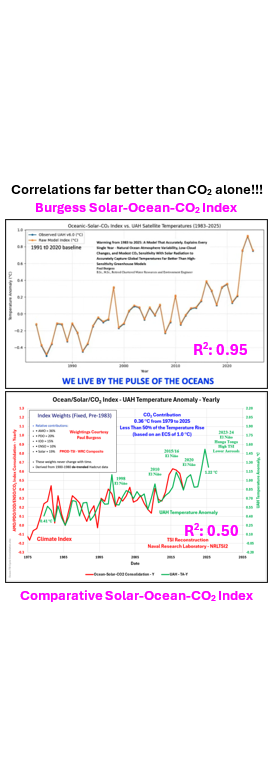
CSS-82 Happy Mother’s Day! The current IPCC models are programmed to respond almost exclusively to anthropogenic forcings as laid out in their ‘best estimates’ website. They choose one TSI reconstruction (out of the 40+ that are available). A TSI reconstruction that fits their All CO2, All the Time alarmist narrative and ignores the many other solar forcings that act over and above the TSI (a proxy at best). They also ignore the major ocean cycles. In my CSS-71 – IPCC Model/Theory Shortcomings post I showed that a model that uses an alternate solar forcing and adds in just one ocean forcing (the AMO) along with a realistic estimate of CO2’s Equilibrium Climate Sensitivity (ECS) provides a far superior history match than the IPCC’s anthropogenic focused ‘best estimates’. Along the same lines, Paul Burgess has produced a Solar-Ocean-CO2 Index (SOCI) that produces a remarkably close correlation with the University of Alabama, Huntsville (UAH) Lower Troposphere satellite temperature data set. This post explores that relationship.
#climatechange #delaythegreen #globalwarming #showusthedata
The Burgess SOCI uses a thought process similar to mine. Climate is much more than just the minor impacts that the All CO2, All the Time alarmist community focuses on. No one parameter dominates the climate all the time and can be expressed differently in different geographic locales. The climate is an amalgamation of the many potential forcings. The fingerprints of solar and ocean activity are present throughout the historical empirical data. The one parameter that does not show up materially in the historical data is CO2. There is NO empirical CO2/Temperature dataset that shows CO2 driving the climate on any statistically significant historical time scale (a very basic requirement of the Scientific Method). CO2 does affect temperature, but CO2 is not a primary climate driver (OPS-80)
The alarmist community points to the last 176 years (1850 to the present) as “proof” that human activity (focused on CO2) is the primary reason temperatures have increased 1 to 1.5 °C since the pre-industrial era (importantly the last vestiges of the Little Ice Age). That is not a statistically significant period in a climate change discussion (i.e.: effectively less than 6 data points). That period also ignores the pre-1850 historical data. Throughout the Holocene Interglacial (10,000+ years), CO2 and other anthropogenic forcings were essentially flat ±98.5% of the time, but somehow the climate (temperature, sea levels, ice extent, etc.) fluctuated significantly and often. Those pre-1850 natural forcings were still active post-1850 and will still be active in the future (just not in the IPCC models). Those natural forcings are necessary to accurately model our planet’s climate. Note, CO2 had a small anti-correlation over the pre-1850 Holocene. There has been some correlation post-1850 (not a proof of causation), but overall CO2 does not correlate with temperature over the entire Holocene (chart attached). CO2 does contribute minor warming (over the last 176 years), but CO2 is not driving our climate in any meaningful capacity.
The IPCC has chosen to minimize the natural forcings included in their evaluations. They have chosen just one of the 40+ TSI reconstructions that are available. They totally ignore the many solar related forcings (Cosmic Ray Flux, High Energy Particles, Solar Wind Strength, Magnetic Field Strength, etc.) that act on our planet over and above TSI alone. They have also not included ocean cycles in their model ‘best estimate’ forcings. They also totally ignore the two cooling parameters that CO2 produces as its atmospheric concentrations rise (leaf cover and co-aerosol production). They choose to focus on one minor trace atmospheric gas (CO2), a very simplistic, unscientific, and dangerous position. Why does the IPCC minimize/ignore the natural forcings? I would suggest the answer is as simple as the natural forcings do not fit the alarmist narrative and their need for control, money and power.
How do they justify minimizing/ignoring the obvious natural forcings? They will argue that there is no mechanism. Not true, since Henrik Svensmark et al have provided a mechanism that directly affects the climate. The Cosmic Ray Flux (moderated by solar activity) affects the particle nucleation required for cloud formation (affecting global albedo and our climate). Is that entire process understood? No, but gravity still existed prior to Newton getting hit on the head with an apple. And how is that different than the IPCC’s unsubstantiated positive water vapor feedback hypothesis. The IPCC proposes that CO2 warming leads to more water evaporation which leads to more warming, which leads to more warming, and so on. The general concept is fine, but the details have not been proven. Once the water vapor enters the atmosphere, what happens to it? Does the water stay as vapor, does the water condense as cloud or precipitation? Remember, the IPCC uses a CO2 ECS range of 1.8 to 5.7 °C in their models, which are self-acknowledged to run too hot. How is that settled science?
The primary purpose of this post is to review the Burgess SOCI. Following the same general process, I was able to produce a similar result. An index that uses solar activity, the four major ocean cycles (AMO, PDO, IOD, and ENSO), and a realistic estimate of CO2 ECS, produces a far superior history match than the IPCC’s anthropogenic focus. My reconstruction and the Burgess SOCI differences are not surprising given that I was unable to use all the inputs that were provided (several Burgess links were broken). I used similar inputs, but the differences could require different weightings. Other forcing parameters may also be acting on the planet that would produce anomalies that are outside the solar and ocean indices used.
Ignoring the natural forcings is a travesty. You cannot understand the anthropogenic forcings without understanding the natural forcings. And, unfortunately, ideology has molded the scientific process in favor of the anthropogenic viewpoint for decades. Censorship, funding restrictions, debate refusal, ad hominin attacks, political power, etc. have all been used to restrict climate realists/skeptics access to academic, media, and political platforms. The empirical data is very complicated but also very clear. CO2 is not the primary climate driver. CO2 is a minor component that has potentially had a significant effect (but very likely less than 50%) over the last 176 years. And CO2’s warming capacity is approaching saturation and may have already reached its limits once its cooling parameters are factored in. CO2’s ECS is not “settled science” and will not be until the natural forcings have been investigated properly. If the IPCC were a scientific organization (they are not, the ‘I’ in IPCC stands for Intergovernmental), they would support, wholeheartedly (intrinsically and financially) the scientific investigation into the natural forcings.
Work done by climate scientists like Happer, Lindzen, Connolly, Soon, etc. have shown that CO2 is not the primary climate driver. And IPCC statements that modelers have self-acknowledged that the models run too hot and along with the official retirement of the implausibly high end RCP8.5 and RCP7.0 emission scenarios have seriously cast the supposed Climate Emergency/Crisis into doubt. A recent paper retraction (Kotz et al 2024, “The Economic Commitment of Climate Change”) has not helped the alarmist communities’ integrity. Even unpaid work done by individuals like me, and Paul Burgess should provide some fuel for further thought and full scientific investigation. We have shown that the existing solar and ocean empirical data can be used to produce far better history matches than the alarmist communities’ anthropogenic focus. The specifics still need more study. Will that study (in meaningful volume) materialize before the current ideological ‘green’ policies bankrupt our societies? Time will tell, but that will not happen until the voting public wakes up to the unnecessary, unscientific, dangerous ideologies that are still being forced upon us by unelected, unaccountable, totalitarian global entities (i.e.: the UN/WEF, etc.).
Unfortunately, we, humanity, have wasted and will continue wasting trillions of taxpayer’s dollars on the ideological pursuit of CO2 reduction at the expense of other real problems and our children’s future. Realization has been coming, but not fast enough.

Paul Burgess, Burgess Oceanic-Solar-CO2 Index Follow-up – Tom Nelson Podcast #375
CSS-71 – IPCC Model/Theory Shortcomings
CSS-71 – IPCC Model/Theory Shortcomings – Revisited
OPS-80 – CO2 Affects Temperature but Does CO2 Drive Climate?

PSL-NOAA – AMO – SST Index (detrended, long blue record)
NCEI-NOAA – AMO Index – ERSST (North Atlantic 0-60N SSTA, gold curve)

PDO Ensemble from NOAA/PSL – COBE SST, NOAA ERSST V5, and HadISST1.1 SST datasets (blue curve)
PDF from NOAA/PSL with the NOAA ERSST V5 SST (red curve, University of Washington)

NOAA PSL – Indian Ocean Dipole (IOD) – Dipole Mode Index (DMI, blue and gold curve)

Nino 3.4 from HadlSST1.1 – NOAA/PSL (black curve)
Southern Oscillation Index (SOI) – Climate Research Unit (CRU, pink curve)
Solar Forcing of ENSO on Century Timescales – Wilcox et al 2023
ENSO Index Variations and Links with Solar and Volcanic Activity – Zharkova et al 2024

Nino 3.4 from HadlSST1.1 – NOAA/PSL (Blue Curve)


Naval Research Laboratories NRLTSI2 – LISIRD (green curve)
Challenges in the Detection and Attribution of Northern Hemisphere Surface Temperature Trends Since 1850 – Connolly, Soon et al 2023
The Detection and Attribution of Northern Hemisphere Land Surface Warming (1850–2018) in Terms of Human and Natural Factors: Challenges of Inadequate Data Soon, Connolly et al 2023
CSS-71 – IPCC Model/Theory Shortcomings
CSS-71 – IPCC Model/Theory Shortcomings – Revisited

OPS-80 – CO2 Affects Temperature but Does CO2 Drive Climate?


CSS-71 – IPCC Model/Theory Shortcomings – Revisited
For more perspective and more detailed analysis, you can also check out some of the following posts.
IPCC Working Group 1 (WG1) Sixth Assessment Report (AR6) Annex III Extended Data
https://zenodo.org/records/5705391
“Burgess Oceanic-Solar-CO2 Index Follow-Up” | Tom Nelson Pod #375
Explaining Every Temperature Change from 1983 to 2025 – Burgess paper
https://substack.com/home/post/p-182701114
Solar Forcing of ENSO on Century Timescales – Wilcox et al 2023
https://agupubs.onlinelibrary.wiley.com/doi/10.1029/2023GL105201
ENSO Index Variations and Links with Solar and Volcanic Activity – Zharkova et al 2024
https://www.scirp.org/pdf/ns2024164_18303679.pdf
Net Zero Averted Temperature Increase – Lindzen, Happer, van Wijngaarden 2024
https://arxiv.org/abs/2406.07392
Challenges in the Detection and Attribution of Northern Hemisphere Surface Temperature Trends Since 1850 – Connolly Soon et al 2023 (CSS-51)
https://iopscience.iop.org/article/10.1088/1674-4527/acf18e
The Economic Commitment of Climate Change – Kotz et al (Published in Nature April 2024, retracted in December 2025)
https://www.nature.com/articles/s41586-024-07219-0 (Retraction Page)
Climate Short Story (CSS)
CSS-71 – IPCC’s Model/Theory Shortcomings
CSS-71 – IPCC’s Model/Theory Shortcomings – Revisited
CSS-75 – Solar Forcing Discussion
CSS-78 – Weakening Electromagnetic Field
CSS-79 – A Common Sense Look at ‘Climate Change’
One Page Summary (OPS)
OPS-80 – CO2 Affects Temperature but Does CO2 Drive Climate?
One Page Political Summary (OPPS)
OPPS-33 – What Happens After Net Zero?


very good put up, i certainly love this website, carry on it