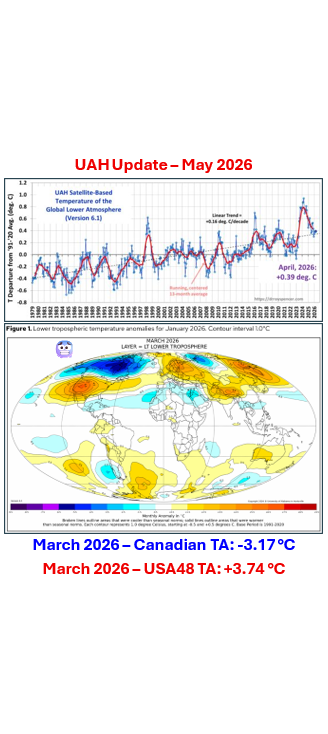
UAH Update – May 2026
CSS-83 As an engineer, I get a lot of pleasure (maybe too much) out of finding new data to plot/analyse. So, I was thankful that Dr. Roy Spencer has added Canada to the University of Alabama, Huntsville’s (UAH) satellite temperature data set. Canada/Alberta is still home with deep roots in Saskatchewan (separatist sentiments not withstanding). Comparing Canada’s temperature status with the rest of the world just became a lot easier. And what do we find? Canada is not warming appreciably faster than any other land mass on the planet (apart from Antarctica).
#climatechange #delaythegreen #globalwarming #showusthedata
The whole ‘warming faster’ discussion is ultimately meaningless except as an avenue to promote ‘climate fear’. The overall global temperature rise has been moderate since satellite estimates became available. Up until the anomalously high temperatures since January 2023, the temperature was rising at 1.31 °C/century (a rate seen in the early 20th century well before major anthropogenic influence). The higher temperatures in 2023/24/25 have increased the average rise to 1.56 °C/century (a 19% jump) but very little of that can be contributed to CO2 or other anthropogenic forcings since those changes have been negligible over the last 3+ years. The recent temperature rise is due to some combination of an El Niño, the Hunga-Tonga-Hunga stratospheric water injection eruption, reduced aerosol shipping emission legislations, improved air quality in China, peak solar activity levels in Solar Cycle 25, and possibly higher seismic/volcanic activity along the tectonic plate margins.
The weighting of each of those parameters is still up for debate and will not be solved here. In fact, most of ‘climate science’ is not settled science. And I am not talking about the different positions between the alarmist and skeptic/realist points of view. The IPCC uses a 1.8 to 5.7 °C range for CO2 Equilibrium Climate Sensitivity (i.e.: not settled science internally). Especially given that all their models, self-admittedly, run too hot (i.e.: 1.8 °C is too high). They may finally tighten that range up now that they have admitted that the RCP8.5 (ssp5-8.5) emission scenarios are officially implausible and will no longer be used in their models.
However, their models will still run too hot since they still ignore the full range of solar related forcings that act on our planet. The IPCC focuses on just one out of the over 40+ Total Solar Irradiance (TSI) reconstructions available. The Matthes et al 2017 TSI reconstruction is one of many PMOD analyses, which are generally more subdued than the alternative ACRIM analyses. The attached figure details 27 of the 40+ available TSI reconstructions (including the IPCC’s Matthes et al ‘best estimate’ option). Another area of ‘climate science’ that is NOT ‘settled science’. The IPCC has chosen to use just one of the PMOD reconstructions. Why not choose one of the Egorova or Shapiro PMOD reconstructions or an ACRIM reconstruction? To start with, these more pronounced options do not conform to the All CO2, All the Time alarmist narrative. The IPCC models also ignore any solar forcing outside of TSI (a minor component overall). Cosmic Ray Flux (CRF), High Energy Particles (HEP), magnetic field strength, solar wind strength, ocean cycles, etc. are stronger solar forcings which are not even incorporated into the model output. Note, CRF and HEP have been programmed into the CMIP computer protocols, they have just been turned off or way down in the official projections.

All TSI reconstructions can be used to produce much better history matches than the IPCC’s anthropogenically focused approach, if they are used as a proxy. The ocean cycles (AMO, PDO, IOD, and ENSO) are all prominent ocean cycles that strongly influence global temperatures. Over the satellite era, ENSO (the shorter-term fluctuations visible throughout the UAH data) and the AMO (responsible for a significant portion of the warming from 1975 to 2014) played a significant role in the global temperature (i.e.: not just CO2). There are no ocean cycles in the IPCC ‘best estimate’ set of radiative forcings. The IPCC also ignores the cooling properties of rising CO2 concentrations (increased leaf cover and the co-aerosol production associated with burning hydrocarbon. Ignoring 97.5%+ of the available TSI reconstructions, most of the other solar forcings, oceanic forcings and CO2 cooling parameters is not a robust scientific look at ‘climate change’. Focusing on one parameter is simplistic, unscientific, and dangerous. All these points are discussed in more detail in my CSS-69 – CO2’s Cooling Parameters, CSS-71 – IPCC Model/Theory Shortcomings, CSS-71 – Revisited, CSS-82 – Building a Better, More Realistic Climate Model posts.
To finish I will summarize the latest UAH Canada data. Canada’s temperatures over the satellite period are characterized by two periods of relatively flat or declining temperatures (the first period (15 to 18.5 years, the second 24 years) punctuated by short periods of sharply higher temperatures (unrelated to CO2). These findings are like those put forward by Dr. Joseph Hickey in his December 2025 paper, “Artificial stepwise increases in homogenized surface air temperature data invalidate published climate warming claims for Canada”. Dr. Hickey noted that most of the Canadian surface stations showed a statistically flat profile from 1960 to 1998, a ±1 °C step increase during 1998, followed by a statistically flat period that lasted until 2023 when temperatures started rising anomalously. The rationale for that profile is discussed in more detail in my CSS-77 – The 1998 Step Change in Temperatures post. Does that suggest that CO2 had little to nothing to do with Canada’s temperature rise since 1960? Correlation/causation would suggest that is the case.
As mentioned earlier, Canada’s temperature is nothing out of the ordinary when compared with the planet’s other landmasses (except Antarctica which is a very unique situation). All land areas warm faster than ocean areas (except at the North Pole (60 – 90 °N). So, do not be frightened by the inevitable stories that have been and will continue to be produced suggesting that we are all warming faster than every place else in the world. That is just climate fear propaganda. A more important question might be why have Canada’s recent temperature anomalies dropped so dramatically (as I watch the snowfall outside my window here on May 16th) while the USA (lower 48) temperature anomalies are anomalously high?


For more perspective and more detailed analysis, you can also check out some of the following posts.
IPCC Working Group 1 (WG1) Sixth Assessment Report (AR6) Annex III Extended Data
https://zenodo.org/records/5705391
University of Alabama, Huntsville (UAH) Lower Troposphere Temperature – Dr. Roy Spencer
Challenges in the Detection and Attribution of Northern Hemisphere Surface Temperature Trends Since 1850 – Connolly Soon et al 2023 (CSS-51)
https://iopscience.iop.org/article/10.1088/1674-4527/acf18e
Artificial stepwise increases in homogenized surface air temperature data invalidate published climate warming claims for Canada – Dr. Joseph Hickey (December 2025)
Climate Short Story (CSS)
CSS-69 – CO2’s Cooling Parameters
CSS-71 – IPCC’s Model/Theory Shortcomings
CSS-71 – IPCC’s Model/Theory Shortcomings – Revisited
CSS-77 – The 1998 Step Change in Temperatures
CSS-82 – Building a Better, More Realistic Climate Model
One Page Summary (OPS)
OPS-80 – CO2 Affects Temperature but Does CO2 Drive Climate?


I’ve been exploring for a little for any high quality articles or blog posts in this sort of house . Exploring in Yahoo I at last stumbled upon this web site. Reading this information So i’m satisfied to exhibit that I have a very just right uncanny feeling I came upon exactly what I needed. I most for sure will make sure to don’t disregard this website and give it a look on a relentless basis.