IPCC Model/Theory Shortcomings
CSS-71 Hope everyone is having a great Canadian Thanksgiving Weekend! I am Thankful that more and more people are recognizing the problems with the Global Warming, Climate Change, Net Zero, etc. narratives. Are you?
The whole All CO2, All the Time alarmist narrative is predicated on the IPCC CMIP6 computer models which predict catastrophically higher global temperatures and more intense/frequent extreme weather events (all without empirical evidence). More recently, the models have been used to ‘attribute’ higher intensity/frequency to current extreme weather events that are not increasing in either intensity or frequency (according to the empirical data). So, are these models fit for purpose? Should they be used for policy decisions? Do they have any shortcomings? This post answers those questions using the IPCC’s own “best estimates” with two easy, common-sense modifications.
#climatechange #delaythegreen #globalwarming #showusthedata
The IPCC models include (in descending strength) their radiative forcing “best estimates” for CO2 and other Greenhouse Gases (GHG, the dominant warming factor in the models), aerosols (the dominant cooling factor), land use (cooling), stratospheric water (warming), black carbon on snow (warming), contrails (warming), and solar activity (oscillating with minimal overall warming). Volcanic activity has a minor, steady warming, punctuated by short strong cooling events (eruptions). Once all the warming and cooling have been cancelled out, CO2 effectively becomes the primary driver in the model.

What the models do not include are the ocean cycles (and there are many, some more important than others). They are ignored on the premise that the ocean temperatures cycle between hot and cold phases with no long-term trend. That premise is not true. The magnitudes of the trends are not necessarily large, but they should be recognized. Ocean cycles are important on the shorter time scales for allocating temperature changes to the various parameters. A few of those periods are broken down below.
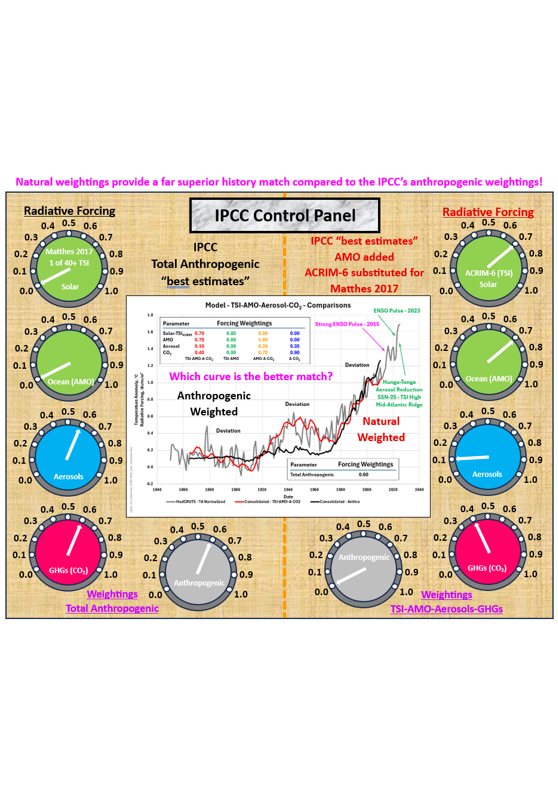
1910 to 1945 – This warming period (the same order of magnitude and duration as 1975 to 2005), has only a minor CO2 influence (87%+ of humanity’s emissions occurred post-1950). That warming corresponds to both the 30-year Atlantic Multi-decadal Oscillation (AMO) warming phase and an increase in Total Solar Irradiance (TSI). In the models the solar activity forcing is extremely muted, leaving that warming to other parameters, not CO2 or TSI. The IPCC’s “best estimates” Total Radiative Forcing projects a minor warming well below the “homogenized” HadCRUT5 surface temperature estimates.
1945 to 1975 – This period cooled despite increasing atmospheric GHGs (primarily CO2) throughout. The model aerosol forcings (cooling but with very large probability ranges) overwhelmed the GHG warming in the models (producing a minor cooling trend). But this period overlaps the 30-year AMO cooling phase. How much of that aerosol cooling is actually AMO cooling? The AMO (assuming no significant solar forcings) was effectively responsible for the 1910-1945 warming. The AMO cooling phase is just as strong as its warming phase and would have contributed significantly. Solar forcing peaked around 1950, leveling off except for a brief drop in the late 1960s/early 1970s during the Ice Age is Coming scare. Minimal influence over this period.
1975 to 2005 – This 30-year warming period again overlaps the AMO warming phase. CO2 concentration continued its accelerated rise, but aerosol forcings leveled out. CO2 could have played a significant role in the temperature rise over this period, but the AMO forcing (slightly stronger than the 1910 to 1945 warming) would also have played a major role. Solar forcing post-1950 was generally flat as mentioned earlier.
2005 to 2035 – CO2’s rise has continued with aerosol forcing producing less cooling. The AMO is at the top of its warm phase and will accelerate into its cooling phase soon. Solar forcing has dropped slightly since 2005 and is likely to drop significantly over the next few decades as we move off the Sunspot Cycle 25 high and into a solar minimum (magnitude to be determined). The AMO high combined with a slightly declining TSI appears to have been strong enough to create the 1999 to 2014 temperature ‘PAUSE’. Temperatures are very likely to drop over the next few decades, just not in the models. Ignoring the ocean cycles in the models does not produce a realistic projection of future temperatures. The strong 2015 and 2023/24 ENSO pulses are responsible for most of the post-2014 warming, not CO2. But those and other similar events are not included in the models. They should be.
The models do include a solar forcing, but the IPCC has limited their choice (i.e.: cherry-picked) to just ONE of the 40+ TSI reconstructions available. Their choice fits the alarmist narrative and has been further modified to mute any solar influence. There are many other TSI reconstructions that are capable of history matching the Modern Temperature Record (MTR, 1850 to the present) directly and more closely than the IPCC anthropogenic models do. All those 40+ reconstructions (including the IPCC’s Matthes et al 2017 reconstruction) can be used as a proxy to produce a representative history match of the MTR. All without CO2 contribution. Using the TSI as a proxy is a valid option for modeling. The TSI is a small component of the overall solar forcing, but it is the only solar forcing parameter included as an IPCC “best estimate.” Cosmic Ray Flux (CRF, affecting cloud formation and albedo) and High Energy Particles (HEF) are programmed into the CMIP6 models but have effectively been turned off. When TSI is high, more HEP reach the earth and the CRF is lower due to stronger solar winds, leading to less cloud nucleation (more sunshine hours) and ultimately warming.
During beta testing, the CRF and HEF forcings were capable of history matching the MTR with no CO2 contribution. But that did not fit the narrative. Other solar forcings (electromagnetic field/solar wind strengths, the solar system barycentre, gravity induced increases in underwater volcanic/seismic activity, etc.) were just ignored outright.
There is more to ‘climate change’ than just GHGs. But that is not how the models are programmed. The IPCC “best estimate” Radiative Forcing effectively starts by choosing their preferred solar forcing (Matthes et al 2017 TSI, must keep solar influence to a minimum), rolls in the volcanic forcing, makes their best guess at aerosol forcings, and then throws anything left over into the GHG category.
In the real world there are many other TSI reconstructions that are just as valid as Matthes et al 2017. They should be included in the evaluation (at least as an option). In the real world, all the parameters have a place in a truly scientific analysis. A much better history match can be produced by simply adding in the AMO and substituting the ACRIM-6 TSI reconstruction used in this post for the IPCC’s Matthes et al TSI reconstruction. This history match is more natural forcing oriented with a reduced but still significant anthropogenic contribution (GHGs and aerosols). Adding further ocean/atmospheric cycles/interactions would tighten up that history match.
So, are these models fit for purpose? NO! Should they be used for policy decisions? NO! Do they have any shortcomings? YES! Recognizing solar activity and ocean/atmospheric cycles/interactions produces much better history matches and ultimately better forecasts. A fix that the current models that run too hot and use unrealistically high emission scenarios (according to the modellers) desperately need.


Soon, Connolly et al 2023 The Detection and Attribution of Northern Hemisphere Land Surface Warming (1850–2018) in Terms of Human and Natural Factors: Challenges of Inadequate Data
Center for Environmental Research and Earth Sciences (CERES)

CSS-29 – Climate Model – TSI-AMO-CO2
OPS-8 – Basic Climate Model


For more perspective and more detailed analysis, you can also check out some of the following posts.
IPCC Working Group 1 (WG1) Sixth Assessment Report (AR6) Annex III Extended Data
https://zenodo.org/records/5705391
Open Letter – Addendum
Challenges in the Detection and Attribution of Northern Hemisphere Surface Temperature Trends Since 1850 – Connolly, Soon et al 2023
https://iopscience.iop.org/article/10.1088/1674-4527/acf18e
The Detection and Attribution of Northern Hemisphere Land Surface Warming (1850–2018) in Terms of Human and Natural Factors: Challenges of Inadequate Data – Soon, Connolly2 et al 2023
https://www.mdpi.com/2225-1154/11/9/179
Center for Environmental Research and Earth Sciences (CERES)
ACRIM Gap Discussion
Climate Short Story (CSS)
CSS-29 – Climate Model – TSI-AMO-CO2
CSS-52 – Extreme Weather Events
CSS-37 – Hurricanes – Accumulated Cyclone Energy (ACE)
One Page Summary (OPS)
OPS-8 – Basic Climate Model
OPS-56 – The Holocene & Solar Activity
OPS-80 – CO2 Affects Temperature but Does CO2 Drive Climate?


