Temperature Manipulation
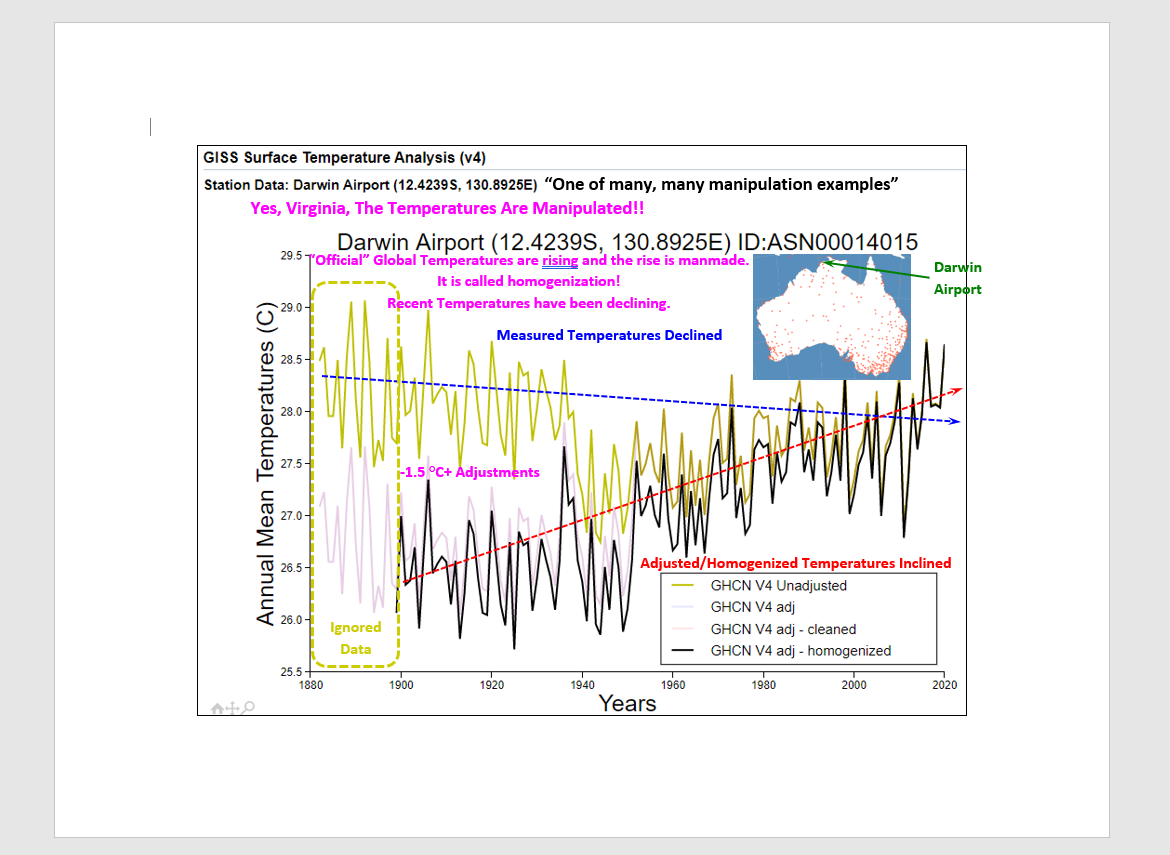
OPS-49 The subject of temperature manipulation (on its own) is a very complex subject (a bit difficult to confine to one page but I am giving it a try). To get an average temperature, some manipulation is required and is called homogenization. Examples of this are (but not limited to) measurements taken at different times of day, interpolation between wide spread stations or urban areas encroaching on rural weather stations (i.e.: the Urban Heat Island Effect (UHIE)). While some “homogenization” is justified, the CAGW alarmist establishment has taken the process to the extreme to promote their idiotological “Global Warming“ narrative. And whether you call it “Global Warming”, “Climate Change”, “Climate Emergency” or the latest scary descriptor is irrelevant. There is no empirical CO2/temperature data set showing CO2 driving the climate on any statistically significant historical time scale. Period. This OPS does show just how out to lunch the NOAA (NASA-GISS, etc.) temperature estimates really are. The record high temperatures of the Dirty Thirties and temperature events like the 1998 Super el Niño did not suddenly disappear from the real world just because they were homogenized out of the IPCC’s virtual reality existence.
#climatechange #delaythegreen #globalwarming #showusthedata
A very good place to research these temperature manipulations in detail is Tony Heller’s website (Real Climate Science) and YouTube channel. He has many US focused examples, but he does also include the entire globe in his analysis. He intertwines the data with news reports of the time to show how homogenization has lost touch with reality. For example, glaciers are growing when the “homogenized” data shows temperatures rising and vice versa. Difficult to do in the real world. He also shows that NASA data used to reflect reality, but they have lost their way with all the other sheep that worship at the UN’s totalitarian altar of “Global Warming”. For those that will quickly point out that Tony Heller is a, “gasp”, Climate Change “Denier”, please detail where the data he presents is incorrect (remember, all the data comes from NOAA).
The same CAGW alarmist headlines we routinely see now (the glaciers are receding at exponential rates, Greenland ice will collapse and sea levels will flood our coastal cities, tropical islands, etc.) were prevalent back in the early 19th century. That switched quickly to the Ice Age is Coming Scare of the mid-70s. Not surprising, since natural cycles have dominated throughout history and will continue to dominate in the future. Bottomline, CO2 is not driving these Modern Temperature Record (MTR) up and down temperature cycles. Solar Activity and ocean cycles are the primary climate driver with minor contributions from CO2. The temperature, CO2 and solar activity data are discussed more extensively on my website. Zeroing in on the following posts will provide a good overview of this discussion (CSS-5 – Snow and Ice, CSS-7 – CO2 – the FECKLESS GreenHouse Gas, CSS-8 – Earth Day – 2021, my Open Letter Addendum and OPS-8 – Basic Climate Model, OPS-38 – Central England Temperatures, OPS-44 – Temperature Averaging Effects and for more detail the Holocene Logic Series (CSS-1, CSS-2, CSS-4, OPS-26, OPS-27 and OPS-36)).

Climate Change and the 1991-2020 U.S. Climate Normals – NOAA
US – Fourth National Climate Assessment
Rewriting America’s History – Tony Heller – YouTube


Pingback: Fact Checking The CAGW Alarmists