CO2-CH4 Concentrations Over the Last 3 Million Years
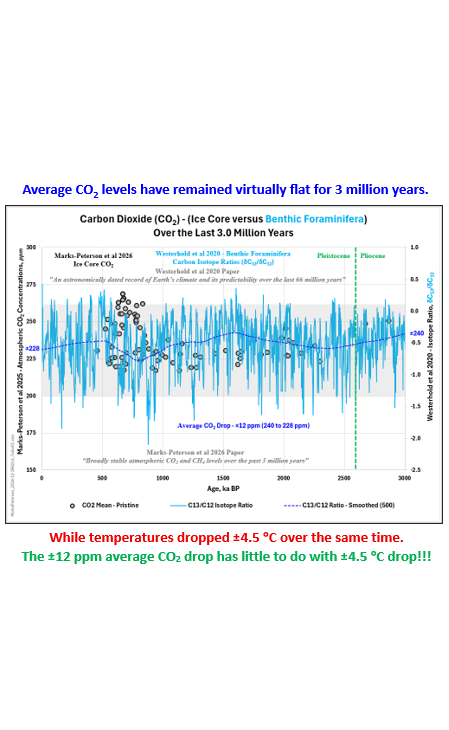
CSS-81 A recent paper (March 2026), “Broadly stable atmospheric CO2 and CH4 levels over the past 3 million years” by Marks-Peterson et al was published in Nature. As the title states, atmospheric CO2 and CH4 levels have been broadly stable for the last 3 million years (based on ice cores from the Allan Hills Blue Ice Area (BIA) in Antarctica). This is great information (unless you are a Catastrophic Anthropogenic Global Waming (CAGW) alarmist). But the Marks-Peterson et al data is just confirmation of an earlier and more comprehensive data set (Westerhold et al’s benthic foraminifera carbon isotope ratio reconstruction).
#climatechange #delaythegreen #globalwarming #showusthedata
In 2020, Westerhold et al published their paper, “An astronomically dated record of Earth’s climate and its predictability over the last 66 million years”. The general stability in the Marks-Peterson et al data provides a confirmation of the Westerhold et al data (focused on the last 3 million years). The Westerhold et al carbon isotope ratio (δC13 ≡ C13/C12) data, a proxy for CO2 levels, fluctuates significantly (in conjunction with the Milankovitch cycles visible in the earlier ice core data sets). Those fluctuations correspond to a CO2 concentration range of roughly 180 to 300 ppm. However, over the last 3 million years, the average CO2 levels have dropped just ±12 ppm (240 to 228 ppm), consistent with the Marks-Peterson ice core data.

The two data sets effectively provide the same information. The major difference is in their resolution. For the Marks-Peterson data more than one million years old, the data is likely just reflecting the average CO2 concentration. There is more variability in the Marks-Peterson data from 400,000 to 1,000,000 years ago. That increased variability is likely due to higher resolution data reflecting more of the Milankovitch cycle influence.
The Westerhold et al data also contains the oxygen isotope ratio (δO18 ≡ O18/O16) data, a proxy for temperature. That data shows that temperatures dropped roughly 4.5 °C over the last 3 million years. The current temperature down trend began around 3.5 million years ago when the Panama Isthmus finally closed. Temperatures were already dropping as the Panama Isthmus was closing, just at a lower rate. So, is that ±4.5 °C temperature drop due to the ±12 ppm drop in average CO2 concentrations? Not a chance! Natural forcings were producing the changes in temperature over the last 3 million years and the CO2 changes were following that temperature change. A minor portion will be CO2, but the magnitude is dependent on CO2’s climate sensitivity.
The Marks-Peterson and Westerhold et al data shows that CO2 had, at best, an imperceptible minor influence on our planet’s climate over the last 3 million years. Based on other data sets, that statement also applies over humanity’s existence (the Holocene interglacial warm period). The climate changed vigorously over the last 12,500 years while CO2 concentration levels remained virtually flat in the 265 to 280 ppm range. Since 1850, our CO2 levels have increased to 430 ppm. That ±150 ppm CO2 increase will have contributed to some of the ±1.5 °C temperature increases since 1850. But the natural forcings that have been driving the earth’s climate over the last 3 million years (with little influence from CO2) are still active. Just not in the IPCC’s climate models.
The contributions of anthropogenic and natural forcings are not settled science. The IPCC uses a CO2 Equilibrium Climate Sensitivity (ECS) range of 1.8 to 5.7 °C. The climate models self-admittedly run too hot even at the lower end of the IPCC range. Even on the climate realist side, the estimates range from virtually zero to the IPCC’s low end. Not settled science! The IPCC effectively ignores solar activity, using just one out of the 40+ Total Solar Irradiance (TSI) reconstructions. They also ignore the many other solar forcings (Cosmic Ray Flux (CRF), High Energy Particles (HEP), etc.) over and above the relatively minor TSI influence. TSI is more a proxy for solar activity than an absolute value. Again, not settled science!
The links below delve into these general concepts in far more detail. But the climate change picture is far more comprehensive and accurate when solar activity and its influence on ocean cycles, volcanic/seismic activity, etc. are factored into the analysis. Net Zero, the energy transition and other ‘green’ initiatives that are being pushed on society are based on unsettled science that will have no measurable effect on the climate. These unnecessary, dangerous initiatives must be put aside so that we can focus on the real crises (energy, food, financial, crime, etc.) we are already facing. CO2 emissions are not a problem; the wasted capital directed towards their reduction are!

CSS-10 – A Ride Through the Cenozoic


CSS-71 – IPCC Model/Theory Shortcomings – Revisited
CSS-74 – Climate Tipping Points
CSS-75 – Solar Forcing Discussion
CSS-78 – Weakening Electromagnetic Field
CSS-79 – A Common Sense Look at Climate Change
OPPS-33 – What Happens After Net Zero?
OPS-80 – CO2 Affects Temperature but Does CO2 Drive Climate
For more perspective and more detailed analysis, you can also check out some of the following posts.
Broadly stable atmospheric CO2 and CH4 levels over the past 3 million years
https://www.nature.com/articles/s41586-025-10032-y
An astronomically dated record of Earth’s climate and its predictability over the last 66 million years – Westerhold et al
Climate Short Story (CSS)
CSS-10 – A Ride Through the Cenozoic
CSS-71 – IPCC’s Model/Theory Shortcomings
CSS-71 – IPCC’s Model/Theory Shortcomings – Revisited
CSS-74 – Climate Tipping Points
CSS-75 – Solar Forcing Discussion
CSS-78 – Weakening Electromagnetic Field
CSS-79 – A Common Sense Look at ‘Climate Change’
One Page Summary (OPS)
OPS-80 – CO2 Affects Temperature but Does CO2 Drive Climate?
https://climatechangeandmusic.com/co2-affects-temperature-but-does-co2-drive-climate/
One Page Political Summary (OPPS)
OPPS-33 – What Happens After Net Zero?
https://climatechangeandmusic.com/what-happens-after-net-zero/


