Climate Tipping Points
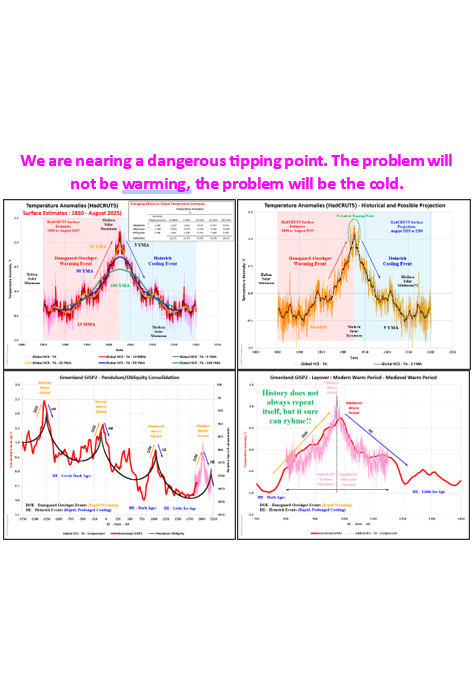
CSS-74 One of the biggest bogeymen in climate “science” are the tipping points routinely used in media headlines to propagate alarmist fearmongering. There are examples of tipping points in the historical data, but they are more often that not associated with changes in parameter direction. Unfortunately, the IPCC is ignoring an obvious, near-term tipping point (the Eddy/Bond solar cycle high). Every ±1,100 years, global temperatures rise sharply (a Dansgaard-Oeschger (DO)event (i.e.: the Medieval Warm Period)), reach a peak and then drop sharply into a long prolonged cold period (a Heinrich event (i.e.: the Little Ice Age). Despite their routine appearances throughout the Holocene (and prior), the IPCC chooses to ignore their existence. Our current consolidated DO/H event is a real tipping point (hot to cold) that will have serious negative implications.
#climatechange #delaythegreen #globalwarming #showusthedata
The current DO event started during the Maunder Minimum (the coldest period of the Little Ice Age (LIA)) and accelerated as the planet warmed out of the Dalton Minimum (the last deep cold of the LIA). The pre-Dalton Minimum warming had nothing to do with CO2 since temperatures began rising centuries before CO2. The warming post-Dalton Minimum is a combination of natural and anthropogenic forcings. And given that 87%+ of humanity’s emissions have been post-1950, the anthropogenic contribution is far more limited than the current IPCC models suggest. Unfortunately, the allocation between natural and anthropogenic forcings is not ‘settled science’. The IPCC continues to rely on the All CO2, All the Time narrative, despite evidence that other natural forcings can history match the Modern Temperature Record (MTR, 1850 to the present) more accurately than current IPCC programming.
There is NO/NADA/ZERO historical evidence that rising CO2 levels will lead to uncontrolled catastrophic temperature increases. On the longer-term scales (the Phanerozoic, the last 541 million years, and the Cenozoic, the last 67 million years), tipping point analysis becomes difficult due to sparse data density. However, that proxy data does show that CO2 changes do not produce runaway temperature effects in either direction (warming or cooling). The data also shows that CO2 and temperature do not correlate on long time scales. Much more detailed discussions on the Cenozoic and Phanerozoic eras are available in my CSS-10 – A Ride Through the Cenozoic and CSS-12 – Cosmic Ray Discussion posts, respectively. The Reader’s Digest version, the major Phanerozoic temperature changes are driven by the solar system’s position within the Milky Way galaxy, and the major Cenozoic temperature changes are driven by geological (plate tectonics) and celestial (extraterrestrial) events. CO2 is playing a minor role, but its role is very dependent on its Equilibrium Climate Sensitivity (ECS, discussed in my OPS-80 – CO2 Affects Temperature but Does CO2 Drive Climate post).
CO2’s ECS is not settled science and based on NASA’s biospheric scientists’ position that there are two CO2 induced cooling parameters (leaf coverage and co-aerosol production) along side its exponentially declining radiative forcing parameter, CO2’s warming capacity may be approaching zero or even cooling at our current concentration levels. That discussion is available in my CSS-69 – CO2 Cooling Parameters post.
Significant tipping points are visible in the ice core data. None of which are CO2 driven. On these time scales (hundreds of thousands to a few million years), the Milankovitch cycles are the primary control knob for both global temperature and CO2 levels. Temperatures over the Pleistocene Ice Age (the last 2.6 million years) have fluctuated between deep ice ages and moderate interglacial warm periods. Over the last one million plus years, the ±100,000-year cycle has been ±90,000 years of deep ice age followed by ±10,000 years of moderate warmth (like the Holocene period we are currently living through). That warming is, unfortunately for future generations, ending. The earlier Pleistocene cycles were shorter at ±40,000 years.

Focusing on the Holocene shows that CO2 remained virtually flat, while pre-MTR temperatures fluctuated significantly. The data shows multiple major tipping points. None of which are CO2 driven. Solar activity (directly and indirectly) is driving these temperature fluctuations. The Greenland data, while localized, prominently shows the solar influence that will ultimately have global implications. (i.e.: the Little Ice Age was global and visible in both hemispheres but played out differently due to the hemispherical differences in land and water distributions). The pre-MTR Holocene natural forcings (solar, ocean, electromagnetic field, solar winds, cosmic ray flux, etc.) have not stopped acting on the planet despite the alarmist decree that anthropogenic (primarily CO2) forcings control the climate. Those natural forcings were present throughout the MTR and will continue to be active in the future (just not in the climate models). As shown in my recent post, CSS-71 – IPCC Model/Theory Shortcomings, a combination of natural and anthropogenic forcings (weighted to natural) produces a far better history match than the IPCC’s anthropogenic focused “best estimates” programming.

The Modern Temperature Record (MTR) has not yet reached its tipping point. But we are closing in on that reality as the current Dansgaard-Oeschger approaches its peak and transitions sharply into the next cold Heinrich event. CO2 may be contributing to the warming, but the warming (the DO event) started long before CO2 began rising and long before humanity’s influence could have contributed significantly. Over 87% (and rising) of humanity’s emissions occurred after 1950. The Heinrich event will look much like the mirror image of the MTR warming. This post focused on the HadCRUT5 surface temperature data (1850 to the present). In my opinion “over homogenized” leading to higher temperatures than reality, but still useable for this thought experiment. Plotting the full projected DO/H event out over the next two centuries produces similar profile results to previous events like the Medieval, Roman and Minoan Warm Periods.
Is the Modern Warm Period close to its peak? That remains an open question. But given that the Atlantic Multi-decadal Oscillation has just started its cooling phase, many astrophysicists are forecasting a Grand Solar Minimum, the large, cold freshwater Beaufort Gyre release is overdue, a Heinrich event is due, and the Milankovitch Cycles are all still pushing us colder, the ‘climate change’ concerns should be cooling, not warming. The combined impact of these cooling events could easily be enough to overwhelm the Atlantic Meridional Overturning Current (AMOC) and lead to an abrupt interruption of the AMOC flow, regardless of whether the AMOC is currently strengthening or weakening. If that happens, the temperature decline will accelerate and solidify the prospects of a new Little Ice Age. How far will the temperature drop? Another open question.
One might also ponder the question; will the coming temperature drop be enough to hit the tipping point that takes us into the next deep ice age? Probably not on its own, but Mother Nature has never been shy about showing us how little we know about the intricacies of this universe. For those that like to go down interesting rabbit holes for entertainment, do some research on solar micro nova (and/or massive solar flares). That horrific scenario could immediately lead to truly catastrophic temperature increases followed by a deep ice age, all within the next few decades (https://spaceweathernews.com).
The satellite temperature record provides further evidence that natural forcings can easily produce temperature changes on the same order of magnitude as the 1.07 °C temperature increase (since 1850) laid out by the IPCC in their 2021 AR6 report. The 1.07 °C temperature increase in neither unusual or unprecedented, and definitely not dangerous. On this short time scale, the tipping points reflect the switch between warming (El Niño) and cooling (La Niña) events.
Tipping points are not limited to the temperature data. A very definitive tipping point occurred in the mid-1850s. Both sea level data and glacier shortening completely reversed direction with NO input from CO2. Pre-1860, sea level had been declining at 1.15 mm/year. Post 1860, sea levels have been rising at 1.93 mm/year (over all linearly with some minor cyclic decelerations and accelerations that correspond to the warming and cooling of the Atlantic Multi-decadal Oscillation. Something changed in the mid-1850s, and it was not CO2. Given the rather minor impact produced by the AMO over the last 175 years, the mid-1850s tipping point was also not ocean induced. So, what led to the reversal? There has been significant solar activity post-Dalton Minimum (including the Carrington Event, a massive solar flare/coronal mass ejection that would have fried our current electrical grid had it happened today). That activity peaked around 1950 and has remained relatively stable since then with minor declines post-2000.
Glacier data mirrors the sea level data (although the tipping point is not as strongly defined). Pre-1850s, glaciers were advancing as sea levels were dropping strongly suggesting that global temperatures were dropping (they were). Post 1850s, glaciers have been receding as sea levels were rising, suggesting that global temperatures were rising (again, they were). What was not changing in the mid-1850s was the atmospheric CO2 concentrations. And unfortunately for the climate alarmist community, both the sea level rise and glacier shortening have been linear in nature (i.e.: no correlation with CO2 and no acceleration due to CO2).
We are approaching some potential tipping points, but they will not lead to warming. We are very likely headed for much colder temperatures which are far more dangerous than any slight warming that CO2 might provide. The sun (through direct and indirect means) is far more powerful than CO2. Ignoring that fact has already led to societal decline and will lead us further down that path.


Heinrich Event – Britannia Definition


CSS-72 – Holocene Stripe Chart – Fact Check

CSS-16 – Central England Temperature – Model
CSS-29 – Climate Model – TSI-AMO-CO2


CSS-12 – Cosmic Ray Discussion
More discussion and additional detail can be found at the links below.
Dansgaard-Oeschger Event – Britannica Definition
https://www.britannica.com/science/Dansgaard-Oeschger-event
Heinrich Event – Britannica Definition
https://www.britannica.com/science/Heinrich-event
NASA – Global Sea Surface Temperature Anomalies
https://www.earthdata.nasa.gov/news/worldview-image-archive/global-sea-surface-temperature-anomalies
Space Weather News – (Suspicious 0bservers)
Climate Short Story
CSS-10 – A Ride Through the Cenozoic
CSS-12 – Cosmic Ray Discussion
CSS-16 – Central England Temperature – Model
CSS-29 – Climate Model – TSI-AMO-CO2
CSS-58 – More Solar Cycles
CSS-69 – CO2’s Cooling Parameters
CSS-71 – IPCC Model/Theory Shortcomings
CSS-72 – Holocene Stripe Chart – Fact Check
One Page Summary (OPS)
OPS-43 – Glaciers and Sea Level
OPS-80 – CO2 Affects Temperature but Does CO2 Drive Climate?


