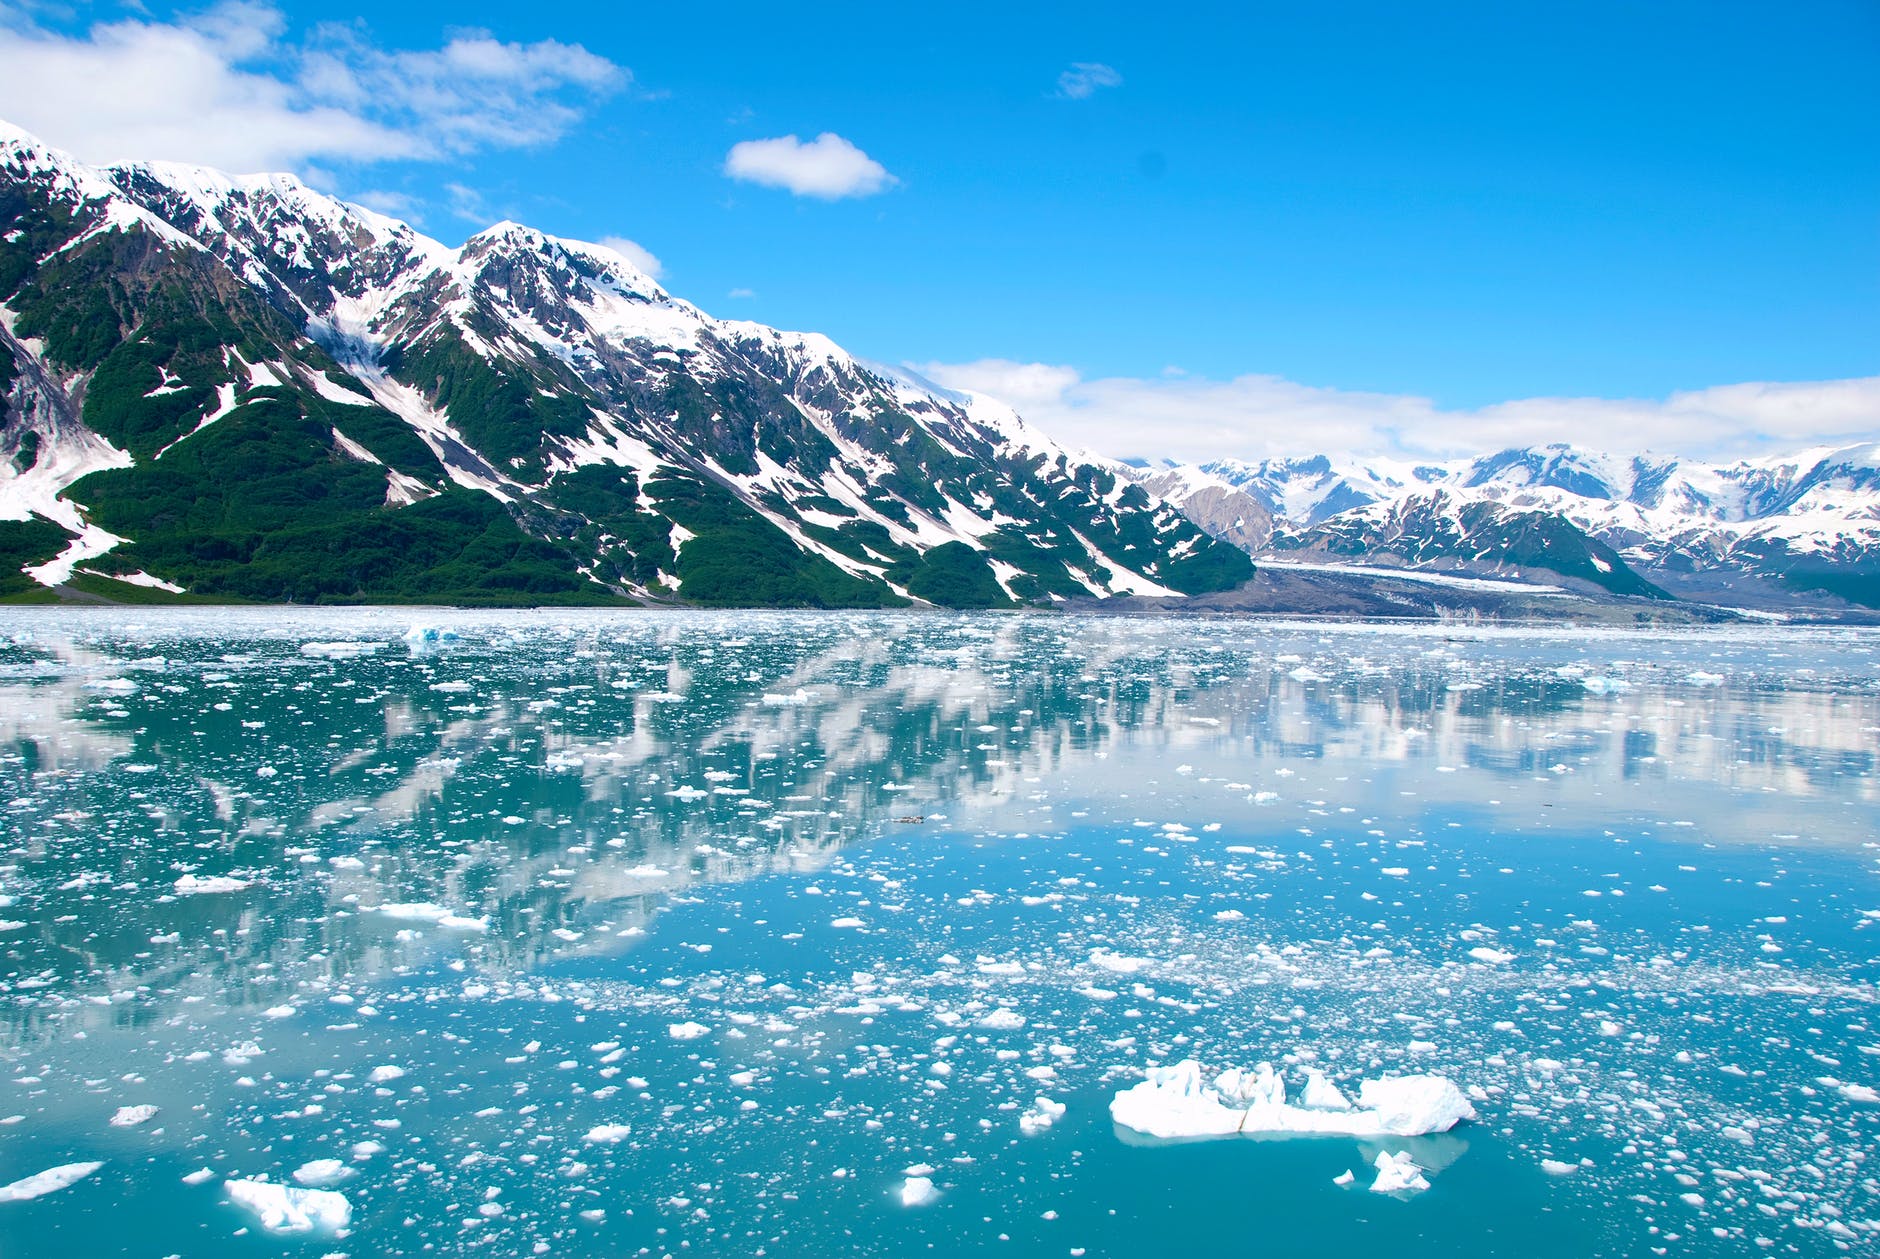
Glaciers and Sea Level
OPS-43 I have seen these plots or similar ones go by lately and thought it would be worthwhile to show them together (i.e.: synced). A quick hat tip to Gregory Wrightstone for posting them. The first thing you should notice is the time frame. The glaciers have been shortening since the early 1800’s and sea levels have been rising since the mid-1800s (long before human CO2 emissions could have had any significant impact). Fun fact, over 86% of all human CO2 emissions have occurred post-1950. Secondly, you should notice that the glacier and sea level trends are relatively consistent (pre- and post-1950). So how can you differentiate between natural and manmade trends?
#showusthedata #globalwarming #climatechange
I have not plotted the temperatures here, but global temperatures have also been increasing since the early to mid-1800s. Coincidentally, Solar Activity hit a low in the early 1800s and increased (with some fluctuations) until 1950 when the Total Solar Irradiance (TSI) levelled out over the Modern Solar Maximum. No chance that could be affecting temperatures, is there? Regardless, temperature, glacier extent and sea level all move in tandem. When temperatures rise (like they have as the planet recovered naturally from the low temperatures of the Little Ice Age (LIA)), glaciers recede and sea level rises (and vice versa). Did CO2 contribute to that warming? Very likely, but you can not easily differentiate between the natural and manmade components (i.e.: not settled science). The ocean cycles, visible in the temperature data (as I have discussed regularly in my Holocene Logic posts, CSS-1, CSS-2, CSS-4, OPS-26, OPS-27 and OPS-36) also shows up in the glacier and sea level plots here (although not as definitively).
But as with most climate discussions, focussing on the Modern Temperature Record (MTR) does not begin to tell the whole story. I have included an additional plot on this post showing the estimated glacial ice volumes over the entire Holocene. The MTR ice record is not at all dramatic (i.e.: not unusual or unprecedented) when compared to the entire Holocene. As I have shown many times, the significant temperature fluctuations over the Holocene have nothing to do with CO2 (since CO2 remained virtually flat over most of that period). As temperatures fluctuated so did glacial volumes and sea levels (again nothing to do with CO2). The natural forcings over the Holocene have not suddenly shut down just because the IPCC computer modellers have declared it so (OPS-22 – Computer Models – Real Simple). And those natural forcings (not programmed into the models) are pointing towards lower (potentially significantly lower and dangerous) temperatures.
The Atlantic Multidecadal Oscillation (AMO), a significant influence on global temperatures is just dropping into its 30-year cold phase. The el Niño Southern Oscillation (ENSO) just turned dramatically colder with the formation of a strong La Niña over the last few months. We are just heading into a Grand Solar Minimum (GSM) that is forecasted to last two or three decades. Historically, GSMs are associated with long periods of very cold temperatures leading to crop failures, mass starvation, poor health and civil strife. You can also layer on the threat of ice migration from the poles (a huge iceberg just split off from Antarctica) and the release of the cold fresh water currently circulating in the Arctic Sea’s Beaufort Gyre (a release that is currently overdue). Those two events have the possibility of triggering a deep ice age (not just a cooling). And we can not forget about Bill Gates’ idiotic pet “Climate Change” project to dim the sun. Mother Nature does not need our help to cool the planet, she has been very effective at doing just that without our help for billions of years.
I personally am much more concerned about the near-term and real Climate Change threats from cooling than the unsubstantiated computer generated CO2 warming 80 years from now. You should be too!

Oerlemans J (2005) – Extracting a Climate Signal from 169 Glacial Records
Mikkelsen Paper Comments
Open Letter Addendum
CSS-1 – Holocene Logic
CSS-2 – Holocene Logic – CO2 Logic
CSS-4 – Holocene Logic – Milankovitch Cycles
OPS-8 – Basic Climate Model
OPS-22 – Computer Models – Real Simple
OPS-26 – Holocene – Temperature-CO2 Logic
OPS-27 – Holocene Logic – Temperature (Simplified)
OPS-36 – Holocene Logic – Simplified 2


