CO2 and Sea Level DO NOT Correlate
CSS-47 I have looked at Sea Level rise a few times recently (links below). This post just adds another perspective by comparing three different data sets. The main take away from this post should be the serious lack of correlation between atmospheric CO2 concentrations and Sea Level changes. No correlation, no dominant causation. And whether you like it or not, sea level is strongly influenced by temperature, calling into question CO2’s correlation to global temperatures. Not surprising since there is no empirical CO2/Temperature datasets that show CO2 driving the climate on any statistically significant historical time scale.
#climatechange #delaythegreen #globalwarming #showusthedata
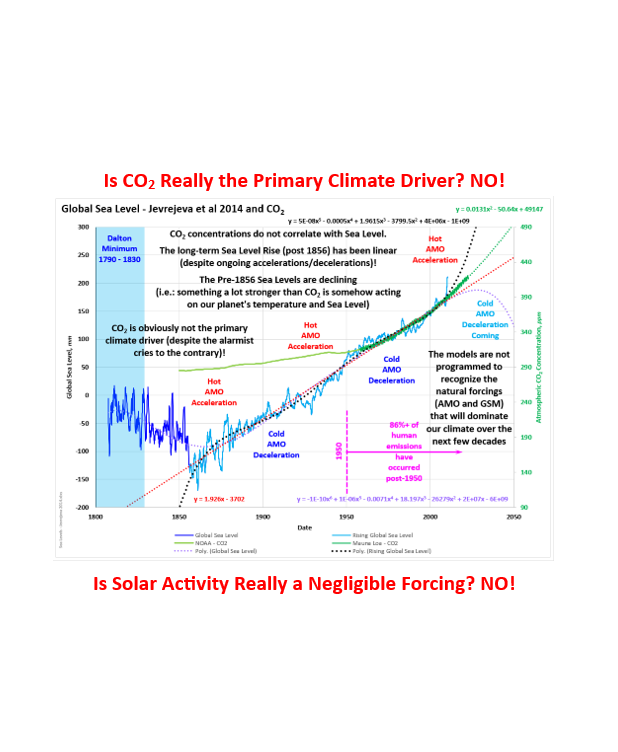
Both the Jevrejeva et al 2014 and Frederikse et al 2020 data sets generally show alternating 30-year decelerations followed by 30-year accelerations (post-1856). Is an exponentially rising CO2 concentration responsible for the post-1856 linear rise in Sea Level? No, the more likely reason for the regular acceleration/deceleration events is ocean cycles (primarily the 60-year Atlantic Multi-decadal Oscillation (AMO)). That deceleration/acceleration cycle will continue, bringing the sea level rise back in line with the long-term linear sea level trend. The AMO is just starting its 30-year cooling phase (i.e.: deceleration). Note, I arbitrarily correlated the CO2 concentrations with the post-1950 period. Over 86% of humanity’s emissions occurred post-1950, so any significant anthropogenic warming would have to have occurred over that period.
But as with all things climate, it’s complicated. Firstly, the discussion has focused on just the ocean cycles and CO2 influence on Sea Level. Solar Activity would also be having an influence (primarily pre-1950). The attached plot shows the global temperatures plotted with the Total Solar Irradiance (TSIM, 20 Year Moving Average, showing influence pre-1950), the AMO (influence throughout the temperature dataset) and CO2 (probable influence post-1950). When comparing the 1900 to 1960 and 1960 to 2020 Sea Level deceleration/acceleration cycle, you could argue that the AMO is the dominant Sea Level driver. The truth is much more complicated than that. The 1900 to 1960 cycle is likely predominantly a combination of the AMO and Solar Activity. The 1960 to 2020 cycle would have a similar AMO contribution with CO2 forcing replacing the solar activity component. This implies that the post-1950 CO2 and pre-1950 solar forcings would have similar strengths. Overall, the oceans are vast and changes in any of these variables appears to have only minor impacts on Sea Level (post 1856).
But what happened around 1856? And why does the CAGW alarmist community NOT show you the pre-1856 data. Because Sea Levels were declining. This does not fit the alarmist narrative and certainly does not correlate with CO2 concentrations (which were essentially flat pre-1850). Something much stronger than ocean cycles, CO2, or even the absolute TSI had obviously been driving Sea Levels (and therefore global temperatures) down. What could possibly be responsible for such a dramatic change in Sea Levels (and global temperatures)? The answer is quite simple for those that understand that the sun’s solar forcings are not limited to the TSI. The TSI just reflects the general changes in the solar cycles. The absolute TSI changes are minor, but they are a general proxy for the much more dominant solar related forcings like Cosmic Ray Flux (CRF), High Energy Particles, Solar Wind Strength, Magnetic Field Strength, Solar Flares/Coronal Mass Ejections, etc. Do you really believe that the IPCC models can replicate the pre-1856 Sea Levels (and therefore Global temperatures) when the models are essentially programmed to respond almost exclusively to CO2 concentrations?
Remember, those models run way too hot (self-acknowledged by the modelers themselves) and still use high emission scenarios that the IPCC has deemed as a low likelihood of occurring. Ignoring the solar forcings that are obviously in play (throughout our recent history), is both unscientific and dangerous. With the combined threat of the AMO cold phase and a Grand Solar Minimum driving down temperatures over the next few decades, we are likely on the verge of another negative solar inflection point. And we are not ready for the coming cold and food shortages. Our illustrious “leaders” fiddle while the world euphemistically (and in some places literally) freezes. NOAA is forecasting essentially no sunspots in Cycle 26. That has not happened since the Maunder Minimum (back in the 1600s). They could soon be having winter fairs on the Thames again and the exponentially diminishing warming effects from CO2 will not stop that scenario from happening. Neither will driving our economies towards financial suicide prepare us for the real problems we will be facing. Time to wake up and embrace/enhance the recent move made by Great Britain (#delaythegreen). Cue the hysterics.


For more perspective and more detailed analysis, you can check out some of the following posts.
Reconstructed Global Mean Sea Level 1900-2018 – NASA – PODAAC – Frederikse et al 2020
https://podaac.jpl.nasa.gov/dataset/JPL_RECON_GMSL
NASA – Vital Signs of the Planet – Sea Levels
https://climate.nasa.gov/vital-signs/sea-level/
National Oceanography Centre – Permanent Service for Mean Sea Level – Jevrejeva et al 2014
https://psmsl.org/products/reconstructions/jevrejevaetal2014.php
https://psmsl.org/products/reconstructions/gslGPChange2014.txt
One Page Summary (OPS)
OPS-23 – Sea Levels
OPS-43 – Glaciers and Sea Level
OPS-55 – The State of Climate Science
OPS-74 – CO2 and Sea Level – 1807 to 2010
Climate Short Story (CSS)
CSS-18 – Sea Levels and Climate Drivers
CSS-33 – Sea Level Rise – Is There Acceleration?
CSS-46 – Sea Level – Fact Check


Pingback: Energy and Environmental Review: October 9, 2023 - Master Resource
Pingback: AWED BALANCED NEWS: We cover COVID to Climate, as well as Energy to Elections. - Dr. Rich Swier
Pingback: Energy and Environmental Review: October 9, 2023 - Climate- Science.press