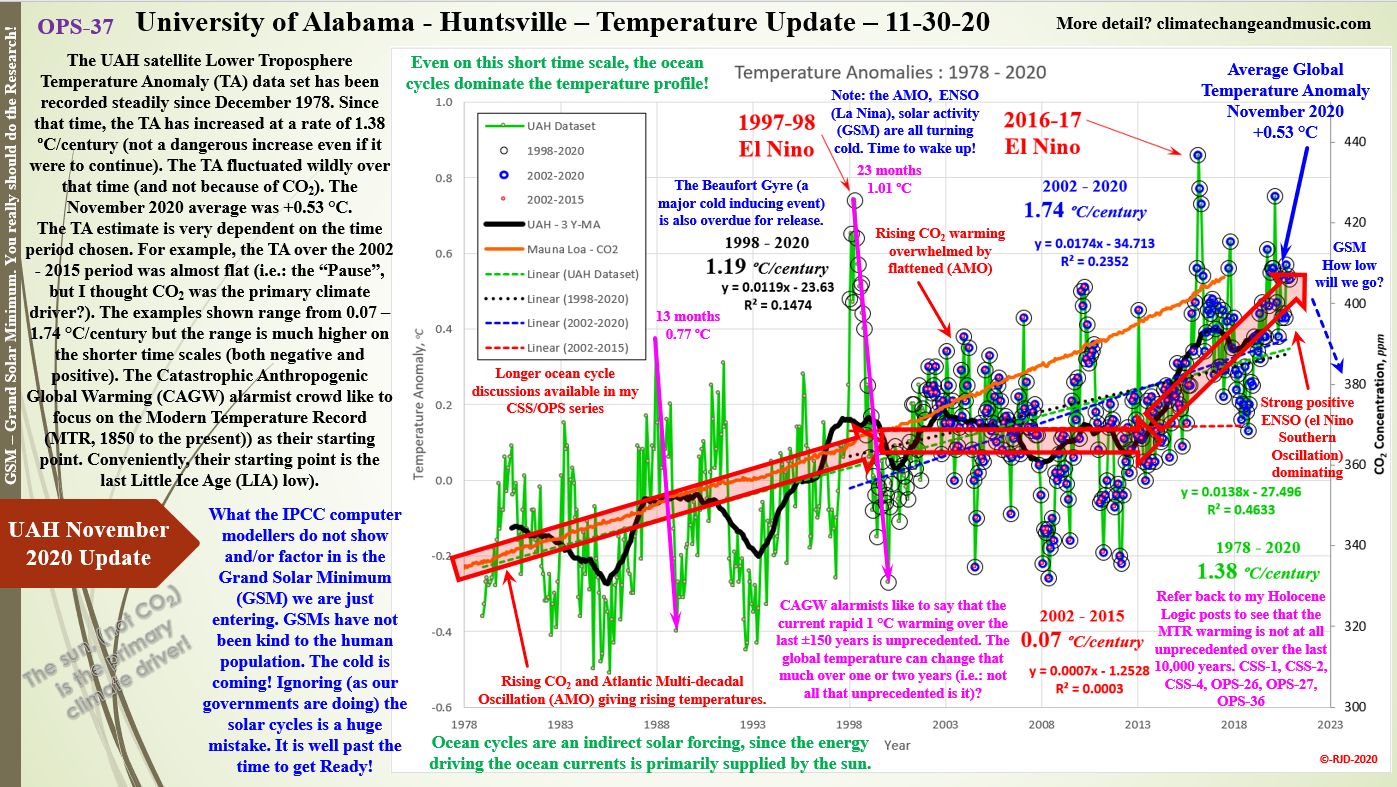
UAH – Temperature Anomaly – November 2020 Update
OPS-37 To start, I hope everyone has a Happy New Year (2021 has to be better than 2020, right?). As the 2021 year begins, I want to get back to the “Climate Change” data (briefly). I will get back to the political fight shortly since that is where the “Great Reset”, Agenda 21, 2030 Agenda and the other Trudeau backed UN global initiatives are taking us. The fight is political, but the data can not be ignored and is required in the battle.
#showusthedata #globalwarming #climatechange
This post updates the University of Alabama Huntsville (UAH) Satellite Lower Troposphere (LT) Temperature Anomaly data set to the end of November 2020. The chart is complicated but that is the essence of “Climate Change”. That complexity is also evident on all historical time scales where CO2 has only ever played minor roles. The simplistic view that our climate is controlled by CO2, is quite bluntly, unscientific. This data clearly shows that CO2 is not controlling the climate (certainly not on its own as the IPCC computer modelers have programmed). CO2 has a very predictable steady incline here. The temperature profile is anything but steady. A linear regression on the full dataset shows that the temperature has increased at 1.38 °C/century over the satellite era. That increase is not dangerous and is not likely guaranteed to continue.
A significant temperature drop is far more likely for a variety of reasons (a strong La Nina (the cold phase of ENSO) has already developed, the Atlantic Multi-decadal Oscillation (AMO) is set to drop into its 30-year cool phase and we are just entering a Grand Solar Minimum (GSM) that will last a few decades). Unfortunately, CO2’s warming capacity is just not strong enough to prevent these temperature drops. I should also mention the Bill Gates funded plan to spread atmospheric aerosols to dim the sun and cool the planet. Sorry Bill but Mother Nature will take care of that all on her own (i.e.: ENSO, AMO and TSI). All Bill will be doing is compounding the serious, declining temperature problems we are already going to face. However, he will most likely earn a merit award from the CAGW alarmists for setting up their cover story to explain the very natural temperature decline using his manufactured narrative.
Now let us discuss CO2’s warming capacity in relation to the temperature data. This data set can be divided into three basic segments. Period one (1978 – 1997) has both CO2 and the AMO acting in concert to increase the LT temperature. Note, that solar activity has remained relatively constant since 1950 when the Total Solar Irradiance (TSI) peaked at the highest levels in the last 7,000 years. The modern high temperatures could not possibly be related to those high solar activity levels, could they? The TSI has dropped sightly since the turn of the century.
Period two (1998 – 2015, flat temperatures) is obviously dominated by forcings other than just CO2. The 1998 temperature spike is due to a very, strong el Nino. Combine that with the flat temperature profile from 2002 to 2015 and you get a qualitative look at the strength of CO2 forcing. Why is the temperature flat for 14 years when CO2 continued to increase over that period? The AMO was roughly flat over this period and as I mentioned earlier the TSI was declining gradually. These weak solar forcings were enough to offset any warming from CO2. The same effect occurred from 1945 to 1975 when the AMO was strong enough on its own to stop any warming from CO2. That period actually experienced a dramatic cooling trend that led to the “Ice Age” is coming Catastrophe theories. The “homogenization” process flattened that temperature decline just like they “homogenized” the record 1930’s high temperatures out of existence.
Period three (2016 – 2020) is dominated by another very strong ocean cycle (the el Nino Southern Oscillation, ENSO). Is CO2 still contributing to warming? The answer is yes, but as before, the ocean cycle response is much stronger than the CO2 response. This might be a good time to remind everyone that CO2’s capacity to warm decreases exponentially as its atmospheric concentrations increase. The AMO on its own was enough to completely counteract CO2’s warming back in the 1950’s. How effective will CO2’s reduced warming be against the combined cooling effects of the ENSO, the AMO and the GSM? Not very and I am not liking our chances. That also assumes that CO2 has not reached the radiative absorption saturation point that many scientists believe it has. In that scenario, CO2 forcings are close to negligible (more info in CSS-3, CO2 Climate Sensitivity).
One of the Catastrophic Anthropogenic Global Warming (CAGW) alarmist talking points says that the 1 °C warming over the last 150 years has been unusual and unprecedented in both magnitude and rate. My apologies to the CAGW alarmists, but that is just not true. Even on this short time scale, there are many examples where the global temperature anomaly increased by 1 °C (or close to it) in as little as one or two years. On longer time scales, there are also many cycles that move the temperature up and down by 1 °C or more throughout the Holocene on similar or shorter time scales. Refer to my Holocene Logic series (OPS-26, 27 and 36 and CSS-1, 2, 4 and 5). All these temperature fluctuation examples have virtually constant CO2 levels.
CO2 is contributing to the temperature increase over the Modern Temperature Record (MTR), just not at the levels the CAGW alarmists claim. Based on the HadCRUT4 surface Temperature Anomaly (TA) data set (5 Year, Moving Average) the MTR temperature low was -0.508 °C in mid-1909. The temperatures increased to +0.07 °C in early 1952. The current TA is roughly +0.65 °C. So effectively, one half of the MTR TA increase (to early 1952) was associated with only 13.7% (227 Gt) of human CO2 emissions. The other 50% TA increase was associated with 86.7% (1455 Gt) of human emissions (implying a CO2 climate sensitivity around 0.2 °C). So, if CO2 is responsible for all the MTR warming (as the CAGW alarmists claim), CO2’s effectiveness must be declining quickly. That does not fit the CAGW alarmist narrative very well. As discussed in CSS-3 (mentioned earlier), the historical CO2 climate sensitivity is probably closer to 1.0 °C, with future CO2 sensitivities up for debate. The ocean cycle dominance shown in the post-1950 UAH data, suggests that the CO2 sensitivity is at the lower end of the scale. That 0.2 °C sensitivity may be close to reality, just not for the right reason. The emission data is available at CO2 emissions – Our World in Data. Total human CO2 emissions are roughly 1686 Gt.

OPS-26 – Holocene – Temperature-CO2 Logic
OPS-27 Holocene – Temperature Logic (Simplified)
OPS-36 – Holocene Logic – Simplified 2
CSS-1 – Holocene Logic
CSS-2 – Holocene Logic – CO2 Logic
CSS-4 – Holocene and the Milankovitch Cycles
Just a quick update to the UAH Temperature Anomaly. I have attached the same figure I posted on New Year’s Day, just for reference. The December Global Temperature Anomaly dropped dramatically to +0.27 °C (that is 0.26 °C in one month). The drop was even more dramatic in many places around the world. The lower 48 States dropped a full 1.00 °C (in one month). The Arctic saw a 0.79 °C drop and Australia was a 1.18 °C drop. Even the Tropics dropped 0.24 °C down to +0.05 °C. The COVID-19 lockdowns must be really driving those atmospheric CO2 concentrations down. Oh wait, that is not what happened. CO2 levels have continued to rise unaffected despite the lockdowns and reduced anthropogenic (human) emissions. The last temperature peak was 0.75 °C in January 2020. A drop of 0.48 °C in 11 months. Another example of how much influence the oceans have on global temperatures. The ocean cycles easily overpower the minor effects of CO2. CO2 can influence the temperature, but CO2 rarely drives the climate. There is a difference.


