
Central England Temperature
OPS-38 Most measured temperature records only go back to the mid-1800’s. The Central England measured Temperature (CET) extends back to 1669 in the middle of the Maunder Minimum. And before we get into any significant discussion, I will acknowledge that the CET is localized and does not necessarily represent the world temperature. However, as shown in the post, both CET and the HadCRUT4 global temperature data do move in parallel for most of the Modern Temperature Record (MTR). As I have discussed in previous posts, the ocean cycles do have a strong influence on global temperatures. The Atlantic Multi-decadal Oscillation (AMO) appears to have a very strong cyclical (roughly 60 years) influence and the el Niño Southern Oscillation (ENSO) is also significant but on a shorter and more irregular basis. There are many other ocean cycles that can affect the global temperatures. For example, the Pacific Decadal Oscillation (PDO, in the early stages of a cool phase) and the Beaufort Gyre (which is overdue to release its cold fresh water into the Northern Atlantic causing a significant cooling event).
#showusthedata #globalwarming #climatechange
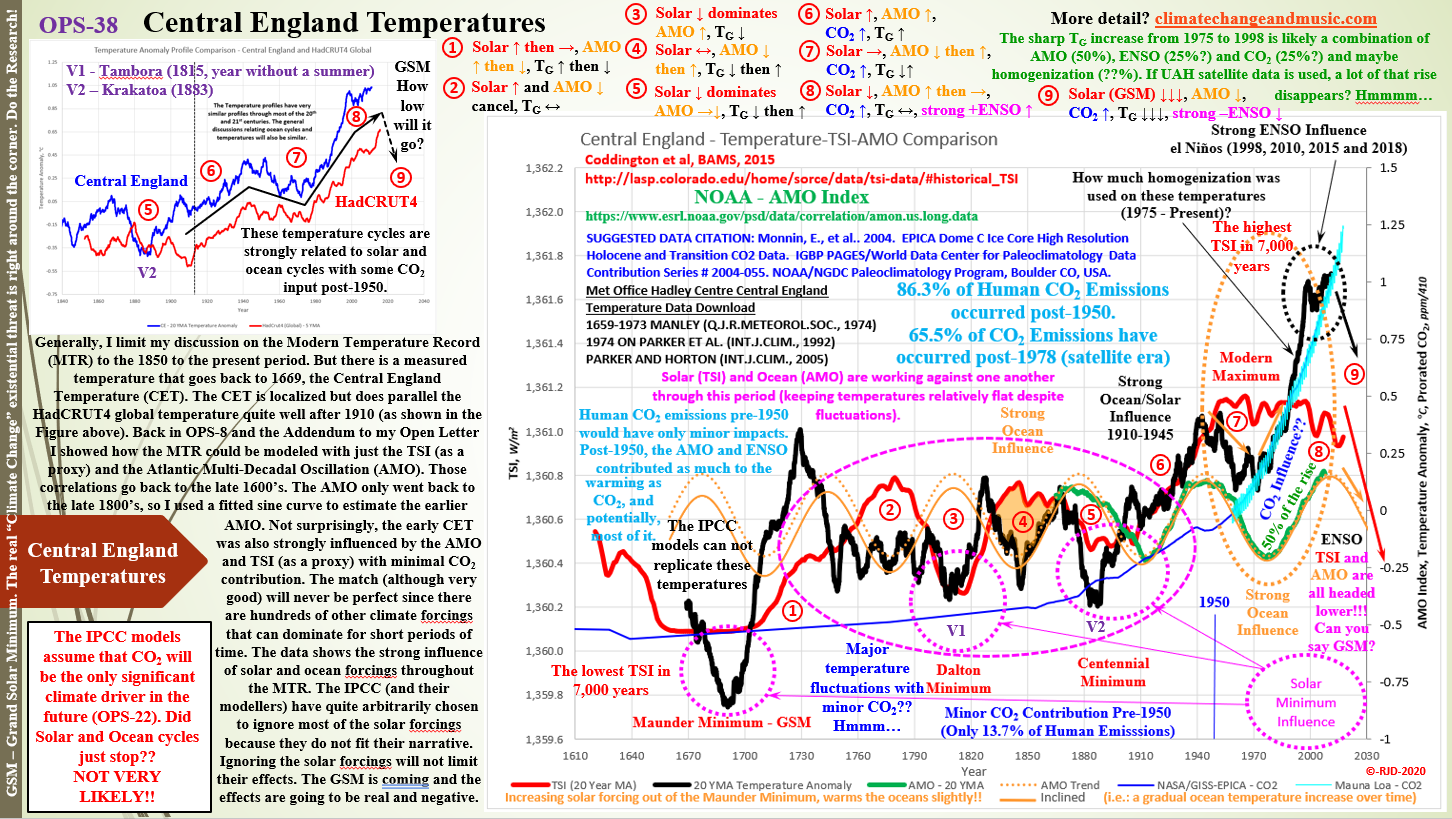
The purpose of this post is to look at the influence of the AMO and solar activity over the extended MTR (eMTR). As shown, 86.3% of human emissions occurred post-1950. Therefore, any Temperature Anomaly (TA) fluctuations pre-1950, are primarily the result of natural processes (solar activity and ocean cycles (an indirect solar forcing)). And despite the IPCC computer programmers decree that CO2 is virtually the only significant climate driver (OPS-22, Computer Models – Real Simple), the solar and ocean cycles are still active. The solar/ocean cycles are also still very visible in the post-1950 TA data. Suggesting, not surprisingly that the CO2 forcings are not that strong (and they will get exponentially weaker as the atmospheric CO2 concentrations increase).
As I laid out in OPS-37 (UAH – November 2020 Update), the ocean cycles were strong enough to counteract CO2’s warming, keeping TAs flat (or declining) from 1945 – 1975 depending on the TA dataset used. Given the ice age is coming scare of the early 70’s, I will go with the TA declining data sets as being the more accurate option. Note, solar activity peaked in 1950 and remained relatively flat until 2000 when the Total Solar Irradiance (TSI) started to decline gradually (i.e.: solar activity influence was minimal over the 1950 to 2000 period).
The 1975 – 1998 time period had a very steep TA incline due to the coordinated warming from both ocean cycles and CO2. The data shows that the AMO is responsible for roughly 50% of that rise. The very strong 1998 el Nino (a warm phase of the ENSO) would have been responsible for another (25% or so), leaving only 25% (or so) for CO2 warming over that period. Refer to OPS-37 (UAH – November 2020 Update) for a more detailed look at the 1978 to the present data.
The TA dropped sharply from the brief 1998 peak and then remained flat over the 2002 – 2015 period. The sharp TA increase in 2016 (another strong el Nino) had very little to do with CO2 since the time frame is too small for any meaningful CO2 forcing. The additional post-2016 el Niño effects have kept those TAs relatively flat until recently. A strong La Niña has just kicked in and already dropped the TA from +0.75 °C in January 2020 to just +0.27 °C in December 2020. So again, the ocean cycles (La Niña, the cold phase of the ENSO) with some small help from a gradually declining TSI has been enough to offset any measurable warming from CO2 (over the 2016 -2020 period).
From an overall point of view, most of the CET warming from 1669 (the depths of the Little Ice Age (LIA)) is obviously due to solar activity with some cyclical inputs from the ocean cycles. And as shown, even in the post-1950 era, the TA effects of CO2 warming were often overridden by the cooling cycles of the AMO. During periods of rapid TA increase, the CO2 warming was working in conjunction with the AMO and/or the ENSO. So how much was CO2 warming the planet over that post-1950 period? Not as much as they would like you to believe! And that doesn’t take into account the questionable over-“homogenization” that surface temperature datasets are subject to. Strange how the record high temperatures of the 1930’s never show up in the surface TA data. But that is a discussion for another day.
I would also suggest that you look back at my Holocene Logic series (OPS-26, 27 and 36 and CSS-1, 2, and 4). You will see the same general result over that 10,000-year time period. Significant temperature (or TA) fluctuations are present, despite an almost flat CO2 profile (pre-MTR). So again, the IPCC modellers are programming their computers to react almost exclusively to CO2, when the solar activity (directly or indirectly) controlled virtually all the temperature fluctuations pre-MTR. And remember as I have shown in this post most of the temperature fluctuations over the eMTR are also solar/ocean forcings. So, I do not (and should not) have any faith in computer models that ignore the solar forcings that have been active for hundreds of millions of years (billions in reality). That means that the models do not have the Grand Solar Minimum (GSM) we just entered, programmed into them. That is a gross oversight, stupid and extremely dangerous.
The computer models are also consistently running too warm. The only model (out of 102) that came close to predicting the Lower Troposphere temperatures over the late 20th and early 21st century was the Russian model (which used a low CO2 climate sensitivity, hmmmmm….). Refer to CSS-3 for a discussion on CO2 Climate Sensitivity. So, I must ask why, after decades and billions of dollars of research and failed predictions, are climate scientists still using the other 101 models? Note, the Russian Model while having accurately forecasted the temperature over the last few decades is not necessarily a good model. They are still ignoring the bulk of the solar forcings and do not show the GSM temperature declines we will experience over the next few decades. Another reason to doubt (or more accurately outright dismiss) the IPCC computer models value.
As I have mentioned many times before, the MTR temperature record can be easily modeled using only TSI (as a proxy) and the AMO (OPS-8, Basic Climate Model and my Open Letter Addendum). That premise has been confirmed in Beta testing of the new CMIP6 computer protocol. CMIP5 protocol used only the TSI as a solar forcing. CMIP6 has added in additional (but not all) solar forcings (i.e.: high energy solar particles and cosmic ray fluctuations). With the new solar forcings added in, the Beta testing showed that the MTR temperatures can be modelled without any CO2 contribution. But the CAGW alarmists do not need to get too alarmed. The solar forcings can and are (unscientifically) being turned off. So, no I do not trust the IPCC models. And neither should anyone with an objective mind.

OPS-22 – Computer Models – Real Simple
Open Letter Addendum
Central England Temperature Data
CO2 Emission Data
HadCRUT4 Surface Temperature Data
Mauna Loa – CO2 Data
NOAA – AMO Data
NOAA – CO2 Data
Solar Activity Data


