Rate of Temperature Change (ROTC) – UAH-LT
CSS-34 This is my second post on the University of Alabama, Huntsville’s Lower Troposphere (UAH-LT) Temperature dataset in the last month. Normally I would not put out a UAH update based on just one additional month of data. But there was an interesting article posted on the Watts Up With That website that looked at the Rate of Temperature Change (ROTC). The article was interesting and there were some additional perspectives that I could layer in. The general take away from the article and this post shows that the ROTC has declined over the satellite period while the Rate of CO2 Concentration Change (ROCCC) has continually risen over the same period. Not a very strong endorsement of the Catastrophic Anthropogenic Global Warming (CAGW) alarmist narrative. Especially given that over two thirds (66%+) of human emissions occurred over the same period.
#climatechange #delaythegreen #globalwarming #showusthedata
An objective look at the temperature data shows that the temperatures over the Modern Temperature Record (MTR, 1850 to the present) have been strongly affected by natural forcings (primarily solar activity and ocean cycles) with questionable CO2 influence. Despite the very definitive fact that 86%+ of human emissions have occurred since 1950, temperatures declined from 1945 to 1975 (the AMO was overpowering any warming that CO2 may have been providing). During the 1975 to 2005 period, temperatures definitely increased (very similar to the increase experienced from 1915 to 1945). The difference between the two periods is interesting. Over the 1915 to 1945 period, the AMO and solar activity were increasing (while CO2 increases were minor and mostly natural). Remember 86%+ of human emissions were post-1950. The 1975 to 2005 period was again associated with a rising AMO. However, CO2 emissions were significantly higher over this period, with solar activity momentum (TSIM (the 20 Year Moving Average) as a proxy) peaking in 1950 and flattening out.
If solar activity is a none factor as proposed by the CAGW alarmist crowd, then all the 1915 to 1945 warming was very likely due to the AMO. And therefore, most of the warming over the 1975 to 2005 period could also be attributed to the AMO. The most likely scenario, the 1915 to 1945 period increase was primarily due to a combination of AMO, and solar activity and the 1975 to 2005 period was primarily a combination of AMO and CO2. The distributions themselves are a topic for another day. The ‘PAUSE’ (from the late 90s to 2015) shows that some process, most likely the shallow decline in solar activity momentum since the early 21st century, was the reason for the temperatures flatlining. And finally, the temperature profile for the last 7+ years has been down at 1.87 °C/century (as I may mention several times in the post). The evidence certainly suggests that CO2 is indeed a FECKLESS Greenhouse Gas (CSS-7).


CSS-9 – What is the Ideal Temperature
CSS-14 – Has our Planet Been Warmer Than Today’s Temperatures


CSS-32 – UAH-LT Temperature – November 2022
For more perspective and more detailed analysis, you can check out some of the following posts.
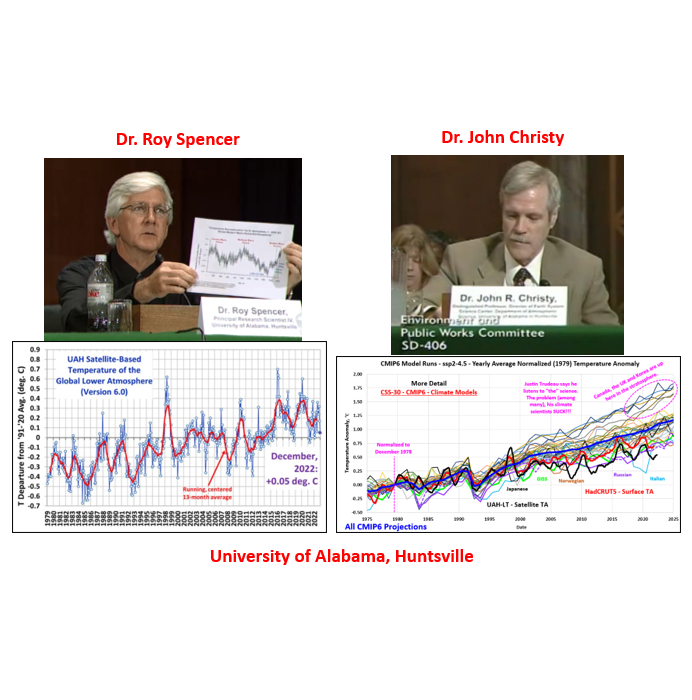
UAH-LT Temperatures – drroyspencer.com
WUWT – Good 2022 Climate News the MSM didn’t tell you
CSS-7 – CO2 – The FECKLESS Greenhouse Gas
CSS-9 – What is the Ideal Temperature
CSS-14 – Has our Planet Been Warmer Than Today’s Temperatures
CSS-25 – Incremental Homogenization – HadCRUT4 to HadCRUT5
CSS-29 – Climate Model – TSI-AMO-CO2
CSS-32 – UAH Lower Troposphere Temperature – November 2022


