Solar Forcing Discussion
CSS-75 I’ll start by wishing everyone a Christmas that is Merry and a New Year that is Happy and Prosperous! This post is a long one. So, I will provide an out for those that do not want to go into too much detail. ‘Climate Change’ is complicated and is a lot more than the simplistic, unscientific All CO2, All the Time alarmist narrative. A proper analysis must include natural forcings (primarily solar activity, directly and/or indirectly). Solar activity will drive our temperatures lower over the next few decades (regardless of how much money we waste on Net Zero, the “energy transition”, Paris, etc.).
#climatechange #delaythegreen #globalwarming #showusthedata
The ±60-year Barycentre cycle (visible in ocean cycles like the AMO and PDO) is headed into its cold phase. Solar activity based on its 350-to-400-year Grand Solar Minimum cycle is dropping into its deep cold phase (think Maunder Minimum cold). And lastly, we are approaching the end of the ±1,150-year Bond/Eddy cycle. The Bond/Eddy’s warming phase began in the depths of the Little Ice age (as per the name, a cold phase), 300 years before CO2 began rising. That warming is likely reaching (and may have already reached) its tipping point. When that happens, temperatures will drop dramatically as they have routinely done so every ±1,150 years throughout the Holocene (with virtually NO CO2 influence).
These events will take our temperatures lower. How much is open for debate. If we are lucky (and this is speculation on my part), the temperature drop will not be enough to push us over the tipping point that has routinely ended every other interglacial warm period over the last few million years by quickly driving us into a deep ice age. A real existential threat, unlike CO2’s minor, beneficial warming. And for those that like a good Hollywood disaster plot, you can research solar micro-nova. Another real existential threat that could take us from near global incineration to ice age within a matter of weeks, sometime over the next few decades. But sure, let’s keep wasting trillions of our taxpayer dollars on ‘climate change’.
The summary to the main document is included below. The PDF version of the CSS-75 Overview can be accessed here. The full Solar Cycle discussion PDF can be accessed here.
Summary
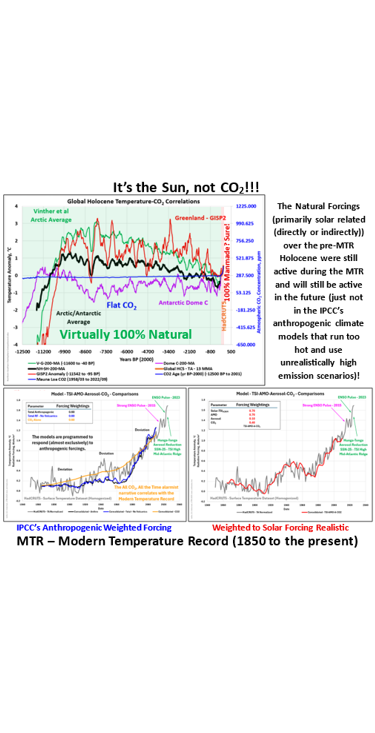
The CSS-75 – Solar Cycle Discussion contains a lot of information. To summarize, I’ll start with the recent history, then finish with the currently important cycles and their potential consequences. The All CO2, All the Time alarmist narrative starts with the IPCC computer models. The initial discussion showed that the IPCC’s “best estimates” of radiative forcing (focused almost entirely on anthropogenic influences) produced history matches that generally correlated with the over-homogenized HadCRUT5 surface temperature estimates from 1850 to the present (Figure 89, below left). A far better correlation can be produced by recognizing solar and ocean cycles as shown in Figure 90, below right. The red curve in Figure 90 was produced by adding in just one of the many ocean cycles (the Atlantic Multi-decadal Oscillation, AMO) and substituting an average of six ACRIM extended TSI reconstructions for the IPCC’s “best estimate” of solar forcing (the Matthes et al 2017 (PMOD extended) TSI reconstruction, just one of 40+ options available). In reality, any of the 40+ reconstructions will produce similar results if treated as a proxy rather than an absolute value. Treating the TSI as a proxy is a valid option given that solar forcings are not limited to TSI (a minor component at best).

The primary test for a climate model is its history match. The anthropogenic (primarily CO2) focused match above is reasonable, but the naturally (solar activity and ocean cycle) focused match (to the right) is far better. But history started prior to 1850. The Holocene (Figure 91, below) experienced substantial climate change despite a virtually flat CO2 concentration. The IPCC’s “best estimates” cannot begin to explain the temperature (i.e.: climate) fluctuations over the Holocene (i.e.: NO history match). If there is no history match, the models are totally useless and unfit for policy purposes (or anything else for that matter).

The natural forcings that created the ‘climate change’ over the Holocene, were still active during the Modern Temperature Record (MTR, 1850 to the present), and they will be active in the future (just not in the climate models). Humanity may have contributed some meaningful warming post-1950 (where 87%+ of our emissions occurred), but pre-1950 contributions were negligible and future contributions are limited due to CO2’s exponentially decreasing warming capacity. CO2’s warming capacity may have already peaked (given that its two cooling properties (rising leaf coverage and co-aerosol production) may already have cancelled out or may soon be cancelling out its radiative warming properties). That discussion is available in my CSS-69 – CO2’s Cooling Parameters post.
The All CO2, All the Time alarmist narrative has questionable application to the MTR and totally falls apart outside of that period. Historical temperature records prove the “narrative” is totally useless pre-MTR, which makes it totally useless for future prognostications. So, what is our climate likely to do over the next few decades? Well, we are not about to leave the Sagitarius-Carina arm of the Milky Way galaxy any time soon so we will continue living through the Pleistocene ice age for several more million years. Our descendants’ future will continue to fluctuate between deep ice ages and interglacial warm periods in sync with the Milankovitch cycles. These are very long cycles that have only minor, virtually undetectable influences on our life today.
The 60-year barycentre cycle is front and centre when it comes to our climate. Our climate moves to that beat. The AMO is the best expression of that 60-year cycle, but as shown earlier there are many others. Greenland (and global) temperatures, cloud albedo, and sunshine hours, rise and fall in sync with the AMO. Most of the recent warming (post 1975) can be explained by changes in the cloud cover and sunshine hours. The AMO is headed colder and will take temperatures lower over the next few decades. The plot below (Figure 92) assumes that solar activity is negligible (i.e.: the All CO2, All the Time alarmist narrative). As such, the 1915 to 1945 temperature rise would have been mostly AMO related since CO2 concentration changes were small. Rolling solar activity back in (as per Figure 90) would compress the AMO cycle by roughly one half. The AMO cold phase will likely reduce temperatures by roughly 0.7 °C.

A major solar cycle playing out over the next few decades is the ±400-year Grand Solar Minimum (GSM). The last GSM was the Maunder Minimum (1645 – 1715). Temperatures during the depths of the Little Ice Age (LIA) were roughly 1.5 °C colder than current temperatures. Will the temperatures drop back to Maunder Minimum levels? The four-component consolidated sinusoidal solar cycle model developed in Figure 93 (directly below) shows a temperature drop that reaches Maunder Minimum levels. The ±1,000-year Bond/Eddy cycle may be the most consequential of the four components affecting our near-term future climate. The Bond/Eddy cycle is most often represented as a sinusoidal curve. The Pendulum curve presented in Figure 94 (below) fits the Greenland GISP2 data better than a sinusoidal curve. At some point, I need to swap out the sinusoidal curve for the pendulum curve. That should tighten up the history match significantly.


As mentioned earlier, the Pendulum Curve has the Milankovitch’s Obliquity cycle built into it. This produces the general downward trend in temperatures. The ±2,300-year Hallstatt cycle (shown in Zharkova’s (Figure 19) and my (Figure 29) solar cycle schematics) is in a warming phase and should also be factored in. The Hallstatt warming would offset some of the Milankovitch cooling until it peaks around 2700. Over the next few decades those cycles will only have minor impacts.
The current warming began during the Maunder Minimum (two centuries before CO2 levels started rising and three centuries prior to when most (87%+) of humanity’s emissions occurred. These interglacial warmings (Dansgaard-Oeschger (DO) events), as shown in the historical empirical data, are frequent and end abruptly (with no historical contribution from CO2). The current DO event likely has some CO2 contribution, but most of that would have been post-1950 and would be sharing the spotlight with the ocean cycles (the AMO, PDO, ENSO, etc.). The DO event was locked in place prior to any CO2 increase and will generally play out the same way it historically has throughout the Holocene. The extra energy injection that accompanies the weakening EMF strength may also be contributing to the DO warming. And that warming literally sets the stage for the coming cooling. Did we reach the DO peak (in April 2024, Figure 95 below)? We shall see. Given the quickly weakening EMF strength, the DO peak will soon be here, if not already.

The Heinrich event will very likely be initiated in the very near future. Given the severe cold and snow currently hammering the planet, we may already be headed down that road. And we should not forget about the overdue cold, freshwater Beaufort Gyre ‘climate bomb’ (Figure 96 below). The Beaufort Gyre release will kickstart and/or layer on to the Heinrich event. Temperatures will drop quickly (with or without the Beaufort gyre release).

We are far more likely to see significant cooling over the next few decades. There could be some additional minor warming before the Heinrich cold event, the AMO cold phase and the GSM cold settle in. How deep will the cold go? That is an open question, but the combination of all these events could be serious enough to push us into a new Little Ice Age and/or potentially push us past the tipping point that has ended every other interglacial period over the last several million years.
An ±X1000 solar flare/CME or a solar micro-nova will ultimately make this entire discussion moot. The real existential threats from ‘climate change’ are far more serious than the minor warming that CO2 may produce. Those threats range from deep ice age to widespread incineration (a solar micro-nova). Humanity has survived both and will again, but not without significant depopulation consequences. In the meantime, we need to enjoy life and adapt to whatever climate gets thrown at us. For the politicians out there, enjoying life would be a lot easier if you stopped with the Net Zero, etc. BS. There is no scientific or economic justification for greenhouse gas emission reductions (Figure 97, below). The All CO2, All the Time alarmist narrative is based on three unsubstantiated principles.
- Greenhouse gases (primarily CO2) are warming the planet to catastrophic levels BUT there are no CO2/temperature datasets that show CO2 driving the climate on any statistically significant historical time scale (a very basic Scientific Method requirement).
- Computer models are used to project those catastrophic temperatures BUT the models have been self-acknowledged to run too hot (by the programmers) and use unrealistically high emission scenarios.
- Extreme weather events are allegedly becoming more severe and more frequent BUT the empirical data (CSS-52 – Extreme Weather Events) and the IPCC (CSS-64 – IPCC – Chapter 12 – Extreme Weather) say otherwise. Note, the extreme weather event attribution studies use those same models that run too hot and use unrealistically high emission scenarios. More pseudoscience!

You are just wasting our taxpayer money on a problem that does not exist at the expense of the real problems we are already facing and additional ones that are on the horizon. Please stop!
Any links to data, posts, papers, documents, etc. can be found on my personal website.
Climate Change and Music – Ron Davison
Solar Forcing Discussion – Slide Presentation


CSS-66 – Are Hurricanes Just Earthspots?

Response of global upper ocean temperature to changing solar irradiance
Connection between the troposphere and stratosphere on a decadal scale
A probable signal of the 11-year solar cycle in the troposphere of the northern hemisphere
Strong coherence between solar variability and the monsoon in Oman between 9 and 6 kyr ago


CSS-29 – Climate Model – TSI-AMO-CO2
Entrevista del mes: Habibullo Abdussamatov
CURRENT LONG-TERM NEGATIVE AVERAGE ANNUAL ENERGY
BALANCE OF THE EARTH LEADS TO THE NEW LITTLE ICE AGE


Open Letter Addendum
OPS-8 – Basic Climate Model

OPS-8 – Basic Climate Model

CSS-42 – The Role of the Sun – Scafetta 2023
The Detection and Attribution of Northern Hemisphere Land Surface Warming (1850–2018) in Terms of Human and Natural Factors: Challenges of Inadequate Data
Challenges in the Detection and Attribution of Northern Hemisphere Surface Temperature Trends Since 1850
CSS-51 – Soon-Connolly – Solar Forcings


A 60-Year Cycle in the Meteorite Fall Frequency Suggests a Possible Interplanetary Dust Forcing of the Earth’s Climate Driven by Planetary Oscillations
Cyclic Climate Changes and Fish Productivity
Forcing for Multidecadal Surface Solar Radiation Trends Over Northern Hemisphere Continents
Migrations and dynamics of the Intertropical Convergence Zone

Centennial scale variations in monsoonal rainfall (Indian, east equatorial and Chinese monsoons): Manifestations of solar variability
A shared frequency set between the historical mid-latitude aurora records and the global surface temperature


Greenland ice


Why is the Earth System Oscillating at a 6-Year Period?

CSS-12 – Cosmic Ray Discussion (Phanerozoic)
CSS-14 – Has Our Planet Been Warmer Than Today?

CSS-71 – IPCC Model/Theory Shortcomings – Revisited

Improving the reconstruction of Holocene geomagnetic paleosecular variation in the Antarctic region
The Convincing Cosmic Energy Gravitational Genesis of the Strongest Geomagnatic Anomalies of the Magnetic Field of the Earth
CSS-36 – Solar Flares and CMEs


Pingback: What Is Chat-GPT’s Thoughts on My Writing?
It?¦s actually a great and helpful piece of info. I?¦m happy that you simply shared this useful information with us. Please keep us up to date like this. Thank you for sharing.