
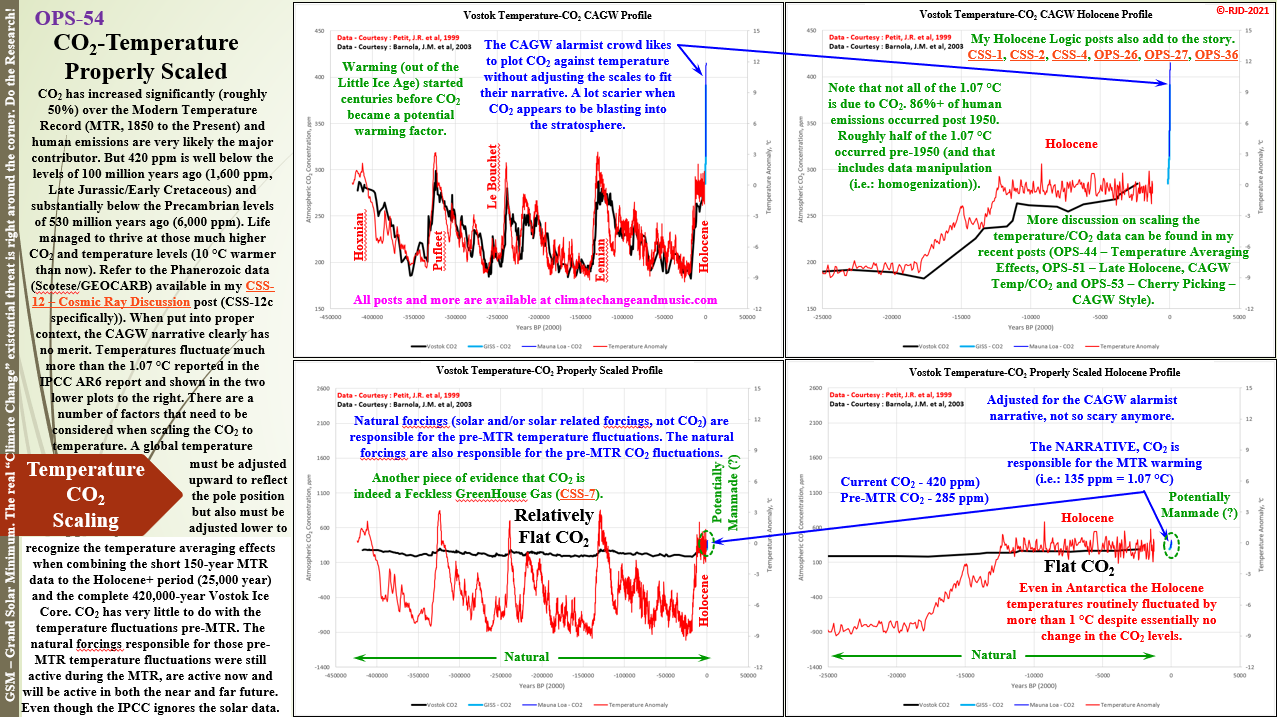
CO2-Temperature – Properly Scaled
OPS-54 The Catastrophic Anthropogenic Global Warming (CAGW) alarmist crowd likes to maximize the visual impact of the rising atmospheric CO2 levels (as shown in the upper two plots on the post). Unfortunately for the CAGW alarmist crowd, the impact on global temperatures is not represented by that visual impact. When the vertical scales are adjusted to reflect the CAGW alarmist narrative (i.e.: the Modern Temperature Record (MTR, 1850 to the Present) warming is due to anthropogenic factors, 135 ppm = 1.07 °C)), CO2 is exposed as a FECKLESS GreenHouse Gas (CSS-7). Pre-MTR temperature fluctuations are obviously due to natural (solar or solar related) forcings. Those natural forcings were active throughout the MTR, they are active now and they will be active in both the near and far future. Despite the IPCC decree that natural forcings are virtually zero (as per their programming, OPS-22 – Computer Models – Real Simple).
#climatechange #delaythegreen #globalwarming #showusthedata
As an aside, I include the IPCC in the CAGW alarmist crowd. The IPCC generally agrees that there is little evidence in the historical empirical data that extreme weather events (hurricanes, tornados, floods, droughts, forest fires, etc.) are becoming more frequent or intense. Not surprising since the opposite is generally true. I am not going to list all the posts that cover extreme events. That data is easy to find on my website (climatechangeandmusic.com). The IPCC also recognizes in their own words, “The climate system is a coupled non-linear chaotic system, and therefore the long-term prediction of future climate states is not possible.” For more detail, I gave a quick review of the IPCC AR6 report in my recent OPPS-16 post. Basically, they are using a lot of word salad to cover themselves quasi-scientifically. However, they still ignore most of the solar forcings and continually homogenize (i.e.: manipulate) the measured data to match their narrative. The narrative includes an unproven fudge factor (I mean positive water vapor feedback) that multiplies the CO2 Climate Sensitivity by up to 3 times.
At least in this report they downplayed the implausible (very likely impossible) RCP8.5 emission scenario. They should have removed RCP8.5 completely. The UN and the compliant media, political, academic, etc. alarmist crowd still latched on to that RCP8.5 scenario to come up with the long running, constant ‘We Are All Doomed If We Do Not Act Immediately’ mantra. The IPCC’s credibility also just took a real hit earlier in August, when their programmers acknowledged that their models are running too hot. Making that statement just a couple of weeks prior to the IPCC AR6 Report release reflects poorly on the IPCC and discredits the AR6 Report (which is heavily dependent on their self admitted invalid computer models). Maybe they should have listened to Dr. John Christy (CSS-6) who pointed out that the models ran hot many years ago (backed up with empirical data). That early work was updated this year based on the new CMIP6 computer protocol and confirmed the original work. In true display of IPCC science incompetency, the new models are more erratic and less accurate.
I tried to keep the technical on this post to a minimum. There is much more detailed data and discussion on this subject on my website for those that are interested. This post is being put forward to show the general concept, promote some discussion and hopefully initiate additional related research. Vostok is not the most representative Antarctic Temperature profile. Most Antarctic Ice Cores have more temperature fluctuation than Vostok. Law Dome C is more representative and is available on many of my other Holocene posts.

CSS-2 – Holocene Logic – CO2
CSS-4 – Holocene Logic – Milankovitch Cycles
CSS-7 – CO2 – The FECKLESS GreenHouse Gas
CSS-12 – Cosmic Ray Discussion
OPS-26 – Holocene Logic
OPS-27 – Holocene Logic – Simplified
OPS-36 – Holocene Logic – Simplified 2
OPS-44 – Temperature Averaging Effects
OPS-51 – Late Holocene – CAGW Temperature/CO2
OPS-53 – Cherry Picking Data – CAGW Style


Pingback: The Hockey Stick Fix
Pretty section of content. I just stumbled upon your blog and in accession capital to assert that I get in fact enjoyed account your blog posts. Anyway I will be subscribing to your augment and even I achievement you access consistently rapidly.
Heya i抦 for the primary time here. I came across this board and I in finding It truly helpful & it helped me out much. I’m hoping to provide one thing again and aid others like you aided me.
Many thanks to you for sharing these wonderful threads. In addition, the perfect travel plus medical insurance plan can often eliminate those problems that come with visiting abroad. A new medical emergency can quickly become costly and that’s likely to quickly slam a financial burden on the family finances. Setting up in place the suitable travel insurance package deal prior to setting off is definitely worth the time and effort. Thanks a lot
Hey there would you mind letting me know which webhost you’re using? I’ve loaded your blog in 3 completely different browsers and I must say this blog loads a lot quicker then most. Can you recommend a good internet hosting provider at a fair price? Thanks, I appreciate it!
Nice weblog right here! Additionally your website a lot up fast! What host are you using? Can I get your associate hyperlink for your host? I desire my website loaded up as fast as yours lol
Write more, thats all I have to say. Literally, it seems as though you relied on the video to make your point. You obviously know what youre talking about, why throw away your intelligence on just posting videos to your blog when you could be giving us something informative to read?