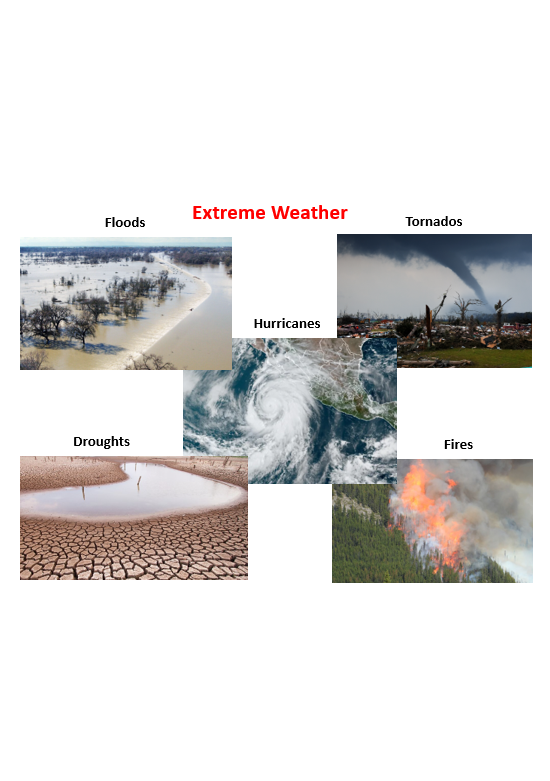
Extreme Weather Events
CSS-52 First, a quick note to acknowledge Remembrance Day. Those lost in past wars made the ultimate sacrifice to preserve the freedom many of us still enjoy today. Unfortunately, those freedoms are at risk on a whole variety of levels (not the least of which is the potential for a WWIII). “Climate Change” is just one, but a significant cog in the machine that is attacking those freedoms. The threat of climate lockdowns (15-minute cities, Central Bank Digital Currencies (CBDC), etc.) are real. This post puts the spotlight on just one example of misinformation associated with the whole alarmist narrative.
To summarize, our political “leadership” and their media/academic lapdogs say extreme weather events are getting worse. The empirical data says otherwise.
#climatechange #delaythegreen #globalwarming #showusthedata
Even the IPCC does not stand behind the extreme weather event narrative. Which is not surprising, given that the empirical data does not support that narrative. Luckily for the ideological alarmists of this world, they can continue to deny reality as long as the general public allows them to do so. Extreme weather events are decreasing not increasing (or at the worst, they are statistically flat).
Tropical Storms have been declining since the mid 1960s. Hurricanes have been declining since the mid 1980s (with the Accumulated Cyclone Energy (ACE) declining since 1990). Extreme Tornado Events (F3-F5) have been declining since detailed reporting began in 1950.
Global acreage burnt declined from 2003 to 2015 according to NASA. The European Space Agency showed the same result and extended the decline to 2018. They also extended the data set to cover 1982 to 2018 (as shown below). US acreage burnt has decreased by roughly 90%+ since 1900. The decline was not linear with some minor increases from the 1983 low, followed by some more recent declines. Note, the US Federal Government has conveniently redacted the pre-1983 data. I wonder why? There are going to be localized exceptions to the rule, with Canada being a good example. Canada set a record acreage burnt this year at roughly 18.5 million hectares (2.6 times the previous post-1980 record). The cries of Climate Change (i.e.: CO2) induced fire activity increases may also have hit a record level. But Canada hit a record low acreage burnt (0.23 million hectares) just a few years ago (2020) and the overall Canadian burnt acreage trend was down. The roughly 6 ppm CO2 increase from 2020 to 2023 is not responsible for the 80 times increase in acreage burned.

The Global area in severe meteorological drought, 1901–2017 measured by the Standardized Precipitation Index (SPI) shows a decline and floods, according to the IPCC “there continues to be a lack of evidence and thus low confidence regarding the sign of trend in the magnitude and/or frequency of floods on a global scale over the instrumental record”. Read the IPCC AR6 Report, the IPCC has many similar responses to other extreme weather events.
According to Rutgers Snow Lab data, the Maximum Northern Hemisphere Snow Extent has been increasing at 100,000 km2/century since 1966 (i.e.: Northern Hemisphere snow extent is one more measure that could be added to this plot, adding one more X to the scorecard). You can also add on the Snow Water Equivalent (SWE) to the discussion. These values have been significantly above normal ever since the 2017/18 winter season (highlighted in my CSS-22 – Snow Update – June 2022 post). This year’s early data (image below, Global Cryosphere Watch) suggests that we are headed for another above normal SWE year. This year’s snow extent is currently above normal. The snow extent usually stays within the shown range but is poised to break out above 57 year maximum.

You will constantly hear reports of extreme weather and they will be attributed to “Climate Change” (i.e.: CO2 emissions), because there is always a flood, a hurricane, a fire, a drought, a tornado outbreak, etc. going on somewhere in the world. The reality, these events are localized, and the extreme event frequencies are not increasing. Based on the available empirical data the extreme events are decreasing or have been statistically flat. Even the odd record is not indicative of “Climate Change”, unless the long-term trends have led up to those records. That has not happened.


Hurricane & Tropical Cyclones – Weather Underground
Researchers Detect a Global Drop in Fires – nasa.gov
Tornado Archive – The Ultimate Tornado Data Viewer
Welfare in the 21st century: Increasing development, reducing inequality, the impact of climate change, and the cost of climate policies – Bjorn Lomborg
For more perspective and more detailed analysis, you can check out some of the following posts.
Multi-decade global fire dataset set to support trend analysis – European Space Agency
https://climate.esa.int/en/news-events/multi-decade-global-fire-dataset-set-support-trend-analysis/
Researchers Detect a Global Drop in Fires – NASA – Earth Observatory
https://earthobservatory.nasa.gov/images/90493/researchers-detect-a-global-drop-in-fires
Welfare in the 21st century: Increasing development, reducing inequality, the impact of climate change, and the cost of climate policies – Bjorn Lomborg
https://www.sciencedirect.com/science/article/pii/S0040162520304157
One Page Summary (OPS)
OPS-63 – Hurricane Update – 2022 Season
Climate Short Story (CSS)
CSS-17 – Forest Fires – March 2022
CSS-22 – Snow Update – June 2022
CSS-37 – Hurricanes – Accumulated Cyclone Energy (ACE)
CSS-41 – Canadian Forest Fires – 2023 Interim Report
CSS-47 – CO2 and Sea Level DO NOT Correlate
CSS-50 – Historical Tornado Data


Pingback: CO2’s Moneyball Moment