The Climate Change and Arsenic Paradox
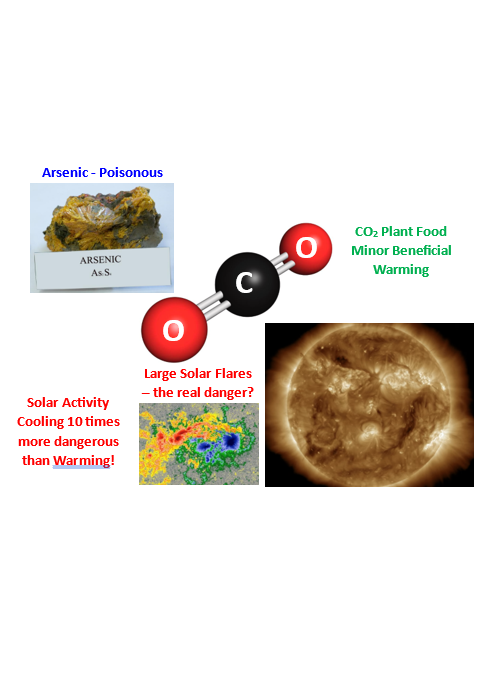
OPS-78 Very small concentrations of some elements/molecules can be very toxic. Arsenic, for example, can be fatal in the 2 to 20 mg/kg range (0.0002% to 0.002%). How is that relevant to ‘Climate Change’? The All CO2, All the Time narrative depends on the Greenhouse Gas Theory (focused on CO2). The premise is simple. The 1.07 °C temperature increase since the pre-industrial era (pre-1850) is primarily due to the 140 ppm CO2 concentration increase over the same period. Climate realists rightly point out that the CO2 change is very small (a 1.4 molecule increase out of 10,000 molecules, 0.014%). The alarmist response is often a variation of my first sentence (i.e.: Arsenic, for example).
#climatechange #delaythegreen #globalwarming #showusthedata
Then when a climate realist rightfully proposes that the sun is a far more important climate driver, the climate alarmist will quickly point out that solar activity level changes are very small and can be ignored in the climate models (those models that are self acknowledged to run way too hot and use unrealistically high emission scenarios). Blissfully unaware of how hypocritical/ironic their logic has become. The Total Solar Irradiance Momentum (TSIM (the 20-year moving average), a solar activity indicator) reached a maximum of 1,361.2 watts/m2 in the mid-1960s (with a fluctuation range of just 1.07 watts/m2 since the mid 1600s). The change is small (0.079%) but is 5.3 times larger than the CO2 change.
Ultimately, any parameter becomes toxic at some level (even something as important for survival as water, that dominant greenhouse gas that the alarmists do not like to bring into the discussion). The efficacy of both CO2 and solar activity is expressed differently in the historical data. CO2’s efficacy is close to non-existent. There are no empirical CO2/Temperature datasets that show CO2 driving the climate on any statistically significant historical time scale (a very basic requirement of the Scientific Method). Atmospheric CO2 concentration changes can influence temperatures, but that influence is lost in the historical data because they are dominated by natural forcings (primarily solar, directly and indirectly). Solar efficacy (directly and/or indirectly) is much more visible.
Over the Phanerozoic (the last 550 million years), the sun’s position within the galaxy determined whether we were in a hothouse or an ice age situation (like today’s Pleistocene Ice Age). As we move around the galactic centre, we move in and out of and above and below the spiral arms of our Milky Way galaxy. When we are in the densest portions of the arms, we are subject to higher Cosmic Ray Flux (CRF). Higher CRF leads to more cloud cover and cooler temperatures and ultimately the deep ice ages. A more detailed discussion can be found in my CSS-12 – Cosmic Ray Discussion post. The indirect solar influence is visible, CO2’s influence is not.
Shortening up the time period to the Cenozoic (the last 66 million years), shows that the major climate shifts are governed by plate tectonics. As the major plates collided and separated, ocean cycles shifted significantly. Ultimately, those changes took the planet from its ice-free conditions (much hotter than today) during the Eocene Climate Optimum to the deep glacial maximums of the Pleistocene Ice Age. A more detailed discussion can be found in my CSS-10 – A Ride Through the Cenozoic post. The indirect solar influence is visible, CO2’s influence is not.
Closer to the present, the Pleistocene Ice Age (the last 2.6 million years) temperature cycles are driven by the Milankovitch cycles (based on orbital and rotational dynamics). Over the Pleistocene, our planet has oscillated between deep ice ages and interglacial warm periods (where ice still exists in the polar regions). The deep ice ages have dominated the Pleistocene (roughly 90% of the time). Over the last 1,200,000 years, the cycles have been roughly 100,000 years in length (90% of the time in deep ice ages). Prior to that, the Pleistocene cycles were shorter at 40,000 years. The global temperatures and CO2 do correlate over the Pleistocene, but the Milankovitch cycles are driving the temperatures which then drive CO2 concentrations. The indirect solar influence is visible, CO2’s influence is not.
The Holocene interglacial warm period (the last 10,000 years+) covers humanity’s transformation from simple isolated agricultural societies to our modern interconnected technological society. The general temperature profile of the Holocene is driven by the Milankovitch cycles, but short-term temperature fluctuations are still plentiful (in both hemispheres) that have nothing to do with CO2, since CO2 levels were statistically flat through 98%+ of the Holocene. These short-term temperature fluctuations are entirely natural and are primarily solar related (more directly, but also indirectly through ocean cycles, Cosmic Ray Flux (CRF), etc.). Both direct and indirect solar influence are visible, CO2’s influence is not.

CO2 concentrations began rising around 170 years ago and have been linked directly to the rather small (but well within natural variability limits) 1.07 °C temperature rise over the same period. Is CO2 contributing to that rise? Definitely, but how much? Despite the All CO2, All the Time alarmist premise that CO2 is responsible for that temperature rise (based on their models that are self acknowledged to run way too hot and use unrealistically high emission scenarios), this 170 year period can be modeled more accurately using just solar activity (no CO2 warming required) as shown in my following posts.
- a simple spreadsheet model using just the Total Solar Irradiance (TSI) and the Atlantic Multi-decadal Oscillation (AMO) to represent the HadCRUT4 temperature profile.
CSS-29 – Climate Model – TSI-AMO-CO2
- a slightly more complex spreadsheet model that brings CO2 back into the mix and extends the time frame out to include the measured temperatures back to 1659 (i.e.: the Central England Temperatures).
CSS-42 – The Role of the Sun – Scafetta 2023
- a review of Nicola Scafetta’s 2023 paper “Empirical assessment of the role of the Sun in climate change using balanced multi-proxy solar records”.
CSS-51 – Soon-Connolly – Solar Forcing
- a review of Soon-Connolly et al’s 2023 paper “The Detection and Attribution of Northern Hemisphere Land Surface Warming (1850–2018) in Terms of Human and Natural Factors: Challenges of Inadequate Data”.
So, even in the HOTTEST TEMPERATURE EVER “epoch” we are living through, those temperatures can be explained without having to invoke the All CO2, All the Time alarmist narrative. Note, the high temperature spike over the last year and a half has a solar component but very little to do with CO2 (CSS-60 – UAH – July 2024 Update – Recent Heat). In reality, CO2 is making a contribution to the temperature rise over the last 170 years (with humanity’s contribution limited to the post-1950 period where 86%+ of our emissions have occurred). But CO2 is not acting alone and is not likely the dominant factor. Solar forcings (directly and indirectly) were also active and will continue to be active in the future.
I went through that brief historical discussion to show that solar and other natural forcings are far more evident in the historical data, than the statistically insignificant CO2 influences that appear fleetingly at best. Both CO2 and solar activity (TSIM) changes have been very small over recent human history. However, solar activity has shown efficacy over that entire history. CO2 may, and I repeat MAY have some efficacy over the last 170 years. So, many factors can have strong negative and positive responses at low doses, concentrations, or magnitudes. But if those parameter responses do not show up in the historical empirical data, that parameter (in this case CO2) is effectively a non-factor.
Unfortunately, the CO2/Solar debate will unnecessarily continue until the general public wakes up to the fact that the All CO2, All the Time narrative does not represent reality.

CSS-53 – CO2’s Moneyball Moment
Here are some additional articles/papers/posts that provide further context to this discussion.
Climate Short Story (CSS)
CSS-10 – A Ride Through the Cenozoic
CSS-12 – Cosmic Ray Discussion
CSS-53 – CO2’s Moneyball Moment
CSS-60 – UAH – July 2024 Update – Recent Heat

