The 1998 Step Change in Temperatures
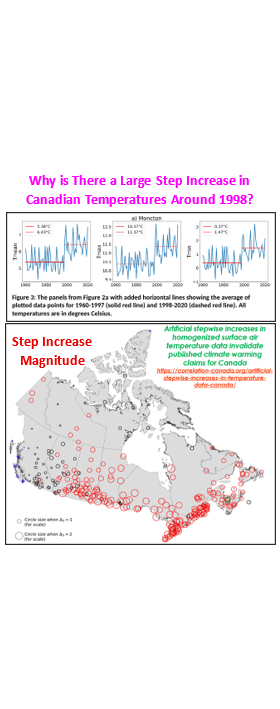
CSS-77 A December 2025 paper by Dr. Joseph Hickey, “Artificial stepwise increases in homogenized surface air temperature data invalidate published climate warming claims for Canada” has been making its rounds on social media, questioning the validity of Environment Canada’s temperature data set. And question them they should, they have issues. With respect to the 1998 step increase, jumping to an artificial label may be premature. There are reasons that the step increase could be natural. That does not rule out that some portion of (or all) the step increase could be artificial. After all, “homogenized” is a term that is synonymous with data manipulation. Either way, Environment Canada should be addressing Dr. Hickey’s concerns.
#climatechange #delaythegreen #globalwarming #showusthedata

A significant step increase in seismic activity along the northern Mid-Atlantic Ridge occurred in 2000. Preceding that increase was the strong 1998 El Niño pulse kicking off the step increase of global temperatures visible in the University of Alabama, Huntsville (UAH) satellite temperature data set. The “homogenization” process does not appear to have added any temperature value to the step increase. In the NASS-GISS dataset, homogenization added 0.205 °C to the 1960 to 1998 period (reducing the step increase) and just 0.035 °C to the 1999 to 2011 period. There was no homogenization in the post-2011 data. The step increase is likely a combination of ocean/atmospheric cycles and seismic activity (which would indicate additional heat release along the continental plates). The step increase in global temperatures is only ±0.2 °C (over long periods) but could have higher values in localized areas (i.e.: the North Atlantic) and certainly on shorter time frames. The very sharp increase would favour ENSO fluctuations and/or seismic induced volcanic activity (CSS-31 – Volcanic Activity). Solar activity likely also contributed to the step change with a sharp increase through 1997 and 1998 to the Sunspot Cycle high (1999-2003).

The primary reason I question the artificial label is the preponderance of station records that show the step increase. Any individual station could have technical or logistical issues that produce abrupt changes. All those stations cannot be having the same equipment problems. Given the areal extent, the measured temperatures are likely real, they just do not fall into the anthropogenic definition of ‘climate change’. That does not rule out data manipulation at the station level, but that would have to be applied prior to the release of official “measured” data. Possible, but not likely. Step changes are much easier to recognize and confirm. The homogenization process is a much easier place to hide data manipulation (should one have the desire to do so).
The ball is in Environment Canada’s court. They need to explain why there is a step increase in temperatures in 1998. If the temperature increase is real (and I suspect a significant portion is) then they should offer reasonable explanations. That would go against their All CO2, All the Time narrative. So, not likely to happen. If there is an artificial reason, it will likely involve data manipulation (that would likely go beyond just Environment Canada). So again, not likely to happen (at least not a reasonable time frame). My money is on continued avoidance. The reality of ‘climate change’ involves much more than just humanity’s emissions. This is just one more case that shows that ‘climate change’ is complicated. A proper evaluation considers all the potential forcings. The answer is not just anthropogenic and not just natural. The reality is a combination, with natural forcings (primarily solar, directly and indirectly) providing the better history matches. More detail in my CSS-71 – IPCC Model/Theory Shortcomings dual posts. Keep pushing and keep up the great work Dr. Hickey!


CSS-31 – Volcanic Activity


For more perspective and more detailed analysis, you can also check out some of the following posts.
Artificial stepwise increases in homogenized surface air temperature data invalidate published climate warming claims for Canada – Dr. Joseph Hickey – December 2025
GISS Surface Temperature Analysis (v4) – Station Data
https://data.giss.nasa.gov/gistemp/station_data_v4_globe
A study of earthquakes along the Mid-Atlantic Ridge between Charlie-Gibbs and the Azores
ENSO Index Variations and Links with Solar and Volcanic Activity – Zharkova et al – 2024
Climate Short Story (CSS)
CSS-31 – Volcanic Activity
CSS-71 – IPCC’s Model/Theory Shortcomings
CSS-71 – IPCC’s Model/Theory Shortcomings – Revisited


