CO2’s Cooling Parameters
CSS-69 What if CO2’s ability to warm the planet is already at or near its end? Rising CO2 does warm the planet through its ability to slow down energy flow (Infrared Radiation) back out to space. But it also cools the planet by adding more leaf cover and more aerosols through the combustion process. Over the last few decades, the leaf cover cooling on its own has very likely taken over as the dominant CO2 forcing (or will soon). Mull that over! Little to no CO2 warming, no need for Net Zero!
#climatechange #delaythegreen #globalwarming #showusthedata
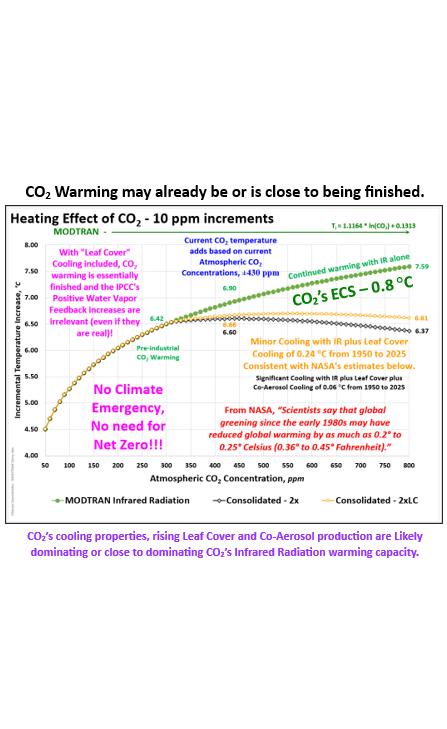
CO2 is put forward by the alarmist community as the reason temperatures have risen by just over 1 °C since the pre-industrial era (a prelude to the catastrophic temperatures that will soon follow). That narrative is based on computer models that are self-acknowledged to “run way too hot” and use unrealistically high emission scenarios. The models use adjusted Equilibrium Climate Sensitivities (i.e.: unsubstantiated positive water vapor feedback is included, ECS) that range from 1.8 to 5.7 °C (not exactly settled science). Given that the models all “run way too hot”, the low end of the range (1.8 °C) is obviously too high. The ECS only considers CO2’s Infrared Radiation contribution. As CO2 levels rise, “Leaf Cover” and “Co-Aerosol” production also increases, contributing to cooling. So, what is the combined effect?
This post comes out of some work done by Forrest Frantz (with Climate Intel, not to be confused with CLINTEL, the Climate Intelligence Foundation out of Europe). NASA’s biospheric scientists have stated that rising CO2 levels can also produce cooling effects through additional “Leaf Cover” and “Co-Aerosol” production (aerosols produced when hydrocarbons are burned). From NASA, “Scientists say that global greening since the early 1980s may have reduced global warming by as much as 0.2° to 0.25° Celsius (0.36° to 0.45° Fahrenheit).” Those are meaningful temperature impacts and are enough to offset two thirds of the IR warming (from 1950 to the present, as shown in the attached figure (warming 0.36 °C, “Leaf Cover” cooling 0.24 °C, net warming to 2025 just 0.12 °C)). More CO2, less warming, transitioning to cooling. There is also the possibility that we are already in the cooling phase.

To get some perspective on how impactful, I plotted some representative projections of “Leaf Cover” and “Co-Aerosol” temperature adjustments. Note these are schematic projections not empirical data and the relationships are assumed to be linear. The starting point is CO2’s Infrared Radiation warming potential (the Equilibrium Climate Sensitivity, ECS). The warming curve included here is based on an ECS value of 0.8 °C (intrinsic to the University of Chicago’s MODTRAN model (which estimates radiation levels escaping back out to space (calibrated to satellite measurements)). The 0.8 °C ECS compares closely with ECS estimates that incorporate the Urban Heat Island effect and realistic natural forcings (i.e.: solar and ocean cycles). ECS is a separate discussion that is addressed in my OPS-80 – CO2 Affects Temperature but Does CO2 Drive Climate? post. The IPCC’s low end ECS estimate of 1.8 °C (which includes their unsubstantiated positive water feedback hypothesis) is 2.3 times the 0.8 °C ECS used here. Is it surprising that the IPCC’s temperature projections are 2 to 3 times the observed values?
I looked at three cooling scenarios. The first assumed that “Leaf Cover” cooled the planet at a rate of 0.0001 C/ppm and the Co-Aerosol cools at a more moderate 0.00005 C/ppm rate. The Leaf Cover estimate is much lower than NASA’s estimate (mentioned previously). The “Leaf Cover” cooling in my projection is 0.12 °C from 1950 to 2025 versus the 0.2 to 0.25 °C NASA estimate from the 1980s (to the early 2020s). I used a lower “Co-Aerosol” estimate to reflect the need for low aerosol emissions from burning hydrocarbons. Harmful aerosols (chemical compounds and particulate matter) need to and can be removed with current technology. These conservative estimates of cooling are enough to limit the amount of warming that CO2 can provide in the future (with or without the IPCC’s unsubstantiated positive water vapor feedback hypothesis). CO2’s relatively narrow Infrared Radiation Absorption Band is becoming saturated and with the “Leaf Cover” and “Co-Aerosol” cooling factors layered on, CO2’s warming capacity may have already reached saturation or will in the near future.
The second scenario doubles the cooling parameters. My second projection uses a “Leaf Cover” cooling of 0.24 °C (based on 0.0002 °C/ppm) from 1950 to 2025. Well within NASA’s estimated cooling range. In this scenario, CO2 has nearly reached saturation and CO2’s temperature impact (from rising CO2 concentrations) will be negative within a few decades. That does not fit the alarmist’s All CO2, All the Time narrative and throws another wrench into their unsubstantiated positive water vapor feedback hypothesis. If CO2 is causing temperatures to drop, their unsubstantiated hypothesis would accelerate the temperature declines. More CO2 and lower temperatures are not convenient for the alarmist narrative. A third scenario uses just the 0.24 °C “Leaf Cover” cooling which shows that CO2 warming has or is very likely close to peaking. There will likely be no more significant CO2 warming going forward regardless of how much CO2 we add to the atmosphere! Suggesting no need for Net Zero, no need for CO2 emission reductions, no need to place a limit on future CO2 emissions, no need to commit economic suicide!
The last slide (CSS-69j) shows very clearly that CO2 is not controlling temperatures in either the Arctic or Antarctica. CO2 is virtually flat, while temperatures fluctuate significantly. The Little Ice Age (LIA, roughly 1300 to 1850) was real and is visible in both hemispheres. The shorter temperature fluctuations play out differently in the different datasets due to the different land/ocean distributions in the northern and southern hemispheres. LIA temperatures bottomed out centuries before CO2 began rising (i.e.: temperatures rose without CO2’s influence). The Medieval Warm Period was obviously warmer than current conditions. The Vikings were able to live in Greenland which would not be the case today. The Romans were able to grow grapes in the northern United Kingdom (i.e.: the Roman Warm Period was also real).
Any temperature rise pre-1950 is primarily natural since 87%+ of humanity’s emissions have occurred post-1950. Roughly half of the temperature rise since 1850 (just over 1 °C) had at best a minor component of CO2 contribution (prior to 1950). Post-1950 temperatures fell for three decades, despite rising CO2 levels, before rising to their current levels (a significant portion of which can be attributed to the ocean cycles (AMO, PDO, ENSO, and others)). The CO2 and temperatures are scaled to represent the alarmists’ viewpoint that the CO2 rise, (140 ppm) is responsible for the 1.07 °C warming since the pre-industrial era. A more realistic estimate is shown on slide CSS-69c. CO2 warming (since pre-industrial) was estimated at 0.48 °C (1850 to 2025). That would represent 40 – 45% of the total warming since the pre-industrial era. CO2 may have provided a meaningful contribution over the MTR (1850 to the present), but most of that contribution would have been post-1950 and is quickly running out of steam.
CO2’s cooling properties are very important to the Climate Change, Net Zero, Energy Transition, etc. discussions. And again, I would like to thank Forrest for providing this perspective (and some of the images). Even with conservative “Leaf Cover” and “Co-Aerosol” projections, the warming effects of CO2 on our climate could be at or approaching zero, making Net Zero a complete waste of time! If CO2 is no longer driving temperatures higher, spending trillions of dollars to stop CO2 warming does not make any sense. CO2 warming has already plateaued and may be headed lower soon. These are just projections, but they are well within the realm of reasonable possibilities. You do not need to be a scientist to understand that more “Leaf Cover” (i.e.: shade) reduces the local and ultimately global temperature. And aerosols are well known to play a key role in cloud formation (i.e.: more shade, cooler temperatures).

Data Source: University of Chicago (MODTRAN)
CO₂ is not a Pollutant — Exposing the Fraud Behind the Global Reset/Green New Deal


Global Green Up Slows Warming – NASA


For more perspective and more detailed analysis, you can also check out some of the following posts.
Energy & Climate at a Glance – Canadian Edition 2024
CLINTEL – World Climate Declaration: There is NO Climate Emergency!
CO₂ is not a Pollutant — Exposing the Fraud Behind the Global Reset/Green New Deal
Data Source: University of Chicago (MODTRAN)
https://climatemodels.uchicago.edu/modtran/ (link currently unavailable)
Carbon Dioxide Fertilization Greening Earth, Study Finds – NASA
Copy and paste the link below if the link is not active.
Carbon Dioxide Fertilization Greening Earth, Study Finds
Global Green Up Slows Warming – NASA Earth Observatory
https://earthobservatory.nasa.gov/images/146296/global-green-up-slows-warming
141 CO2 Timelapse of Flora Growth – WF Frantz
One Page Political Summary (OPS)
OPPS-33 – What Happens After Net Zero?
One Page Summary (OPS)
OPS-55 – The State of Climate Science
OPS-80 – CO2 Affects Temperature but Does CO2 Drive Climate?


