Canadian Temperatures
CSS-68 A member of the Friends of Science Society put forward the following statements and asked a simple question.
Greenhouse Gas Emissions: In 2021, Canada’s total greenhouse gas (GHG) emissions were approximately 672 megatonnes of CO₂ equivalent, marking a 2% increase from 2020.
Temperature Rise: Between 1948 and 2020, Canada’s average annual temperature increased by 1.9°C, with the northern regions experiencing even higher warming.”
Do you have graphs over a period of a century or two that would paint a more accurate picture?
I did not have any graphs specific to that question, but that does not preclude me from making graphs to address that request. Here is my response.
#climatechange #delaythegreen #globalwarming #showusthedata
I downloaded long datasets from 6 stations across Canada (Prince George, Calgary, Regina, Winnipeg, Toronto, and Quebec City). On average, these locations have some important similarities.
- Every location shows a 60ish year long temperature cycling, alternating between warm and cold periods in sync with the ocean cycles (the Atlantic Multi-decadal (AMO, Pacific Decadal Oscillations PDO), and El Niño Southern Oscillation (ENSO on shorter time scales)).
- The 1948 to 2020 period does show some temperature increase at these locations, but the magnitude is not 1.9 °C (whether it is measured or homogenized data). The NASA-GISS measured data averaged just 1.15 °C, the homogenized data was slightly lower at 1.05 °C. Four of the six locations were unusually cold in the late 1940s and early 1950s. Toronto and Quebec City did not experience the western cold around 1948 and had similar temperatures in 1948 and 2020. The 1948 to 2020 (72 years) period is entirely arbitrary and totally irrelevant in a ‘climate change’ discussion. 72 years effectively represents just 2.4 data points.
- 2020 was an El Niño year (i.e.: global temperatures were warmer than the long-term trend) and appears to be cherry picked. Global temperatures were significantly and anomalously warmer during 2023, 2024, and the first three months of 2025 (due to an El Niño, the Hunga Tonga volcanic eruption (blasting enormous volumes of water into the stratosphere), the Cycle 25 solar activity peak, and more stringent shipping emission limits (i.e.: reduced aerosols), but NOT CO2). Interestingly, those anomalously high temperatures do not show up in the Canadian data!
- The temperature trends at these six locations are very modest. With the long-term temperature trends averaging just 1.29 °C/century (measured) and 1.02 °C/century (homogenized). Those numbers will very likely trend lower as the ocean and solar cycles move into their cold phases over the next few decades. In general, temperatures (both measured and homogenized) in Canada have trended down since the strong El Niño in 2015. The temperatures supposedly increased 1.9 °C from 1948 to 2020. That is equivalent to 2.64 °C/century (more than 200% higher than the weather station data shows (measured or homogenized).
These locations are not facing ‘Climate Emergencies’ (which is consistent with the rest of Canada and the world). Breaking down the temperatures further just underscores the lack of emergency. The average maximum daily summer temperatures (1.00 °C/century (measured), 0.55 °C/century (homogenized)) at these locations are rising at much lower rates than the average minimum daily winter temperatures (2.58 °C/century (measured), 2.20 °C/century (homogenized)). Using measured data, winter temperatures are rising 2.6 times faster than summer temperatures. With homogenized data, 4.0 times faster. If you live in Canada, you will understand that is a good thing! Cold kills far more people than heat. A warming planet saves lives!
The discussion to this point has focused on the Modern Temperature Record (MTR, 1850 to the present). In a climate change discussion, that works out to just 5.8 effective data points. Better than the 2.4 data points associated with the cherry picked 1948 to 2020 period, but still not a statistically significant data set. Looking at the entire Holocene provides some sorely needed perspective. Over the last 12,000+ years, CO2 remained virtually flat, yet temperatures fluctuated regularly at magnitudes and rates like the recent 1.07 °C MTR rise (the IPCC’s estimate, not mine). The All CO2, All the Time alarmist narrative contributes all that warming to the 140-ppm atmospheric CO2 concentration increase.
This simplistic, unscientific narrative ignores many very obvious observations. Firstly, the natural forcings that are responsible for the pre-MTR Holocene temperature fluctuations have not suddenly stopped acting on our planet just because the alarmist community has decreed it to be so. Those natural forcings were still active during the MTR and will continue to be active in the future (just not in the climate models). Secondly, over half of the MTR warming occurred pre-1950, while 87%+ of humanity’s emissions were post-1950. Thirdly, temperatures started rising centuries before CO2 began rising. CO2 was obviously not responsible for the pre-1850 temperature increases, and humanity had little to do with pre-1950 MTR temperature rise given that 87%+ of our CO2 emissions occurred post-1950.
The first statement (describing the GHG increase from 2020 to 2021) is hardly worthy of a response, since Climate Change discussions (temperature, emission levels, etc.) are meaningless on short time scales. Unfortunately, when it comes to humanity’s emissions, all we have is short time scales (74%+ of humanity’s GHG emissions (87%+ of humanity’s CO2 emissions) have occurred post-1950). But it is never a bad thing to present all the available data, so I prepared the attached chart. Canada’s GHG emissions increased steadily until the end of the 20th century.

Both GHG and CO2 emissions have been declining since 2000. CO2 emission reduction is lagging behind GHG emission reductions (despite the focus on CO2). So, yes, we are reducing our emissions despite a growing population. Hooray for us. Those emission reductions were accomplished by unnecessarily spending taxpayer money on a problem that does not exist. There is no empirical CO2/Temperature dataset that shows CO2 driving the climate on any statistically significant historical time scale, extreme weather events are becoming less frequent and less severe (despite the constant media barrage to the contrary), and computer models are useless given they have been self-acknowledged (by the programmers) to “run way too hot” and use unrealistically high emission scenarios. There is NO Climate Emergency!
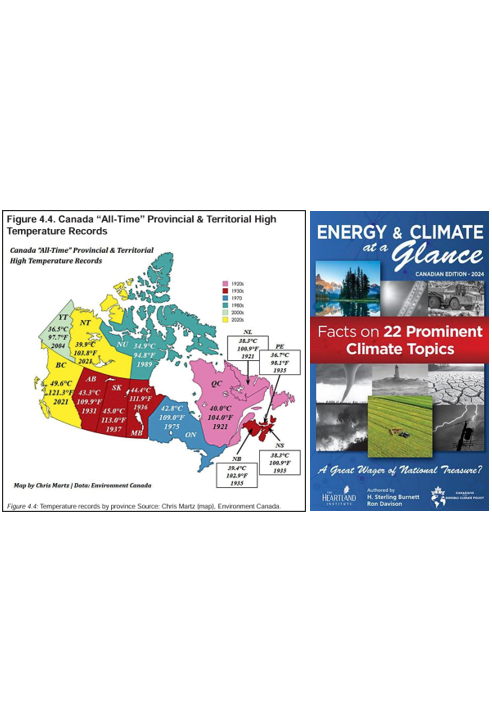
How much is that so called “Climate Emergency” fight costing us? A lot! Sadly, Canadian taxpayers will be spending trillions to save billions, and our share of the temperature reductions (using the IPCC science, as outlined by R. Lindzen et al in their 2024 paper “Net Zero Averted Temperature Increase”) will be somewhere in the 0.004 °C range (at a cost of $10 trillion plus for every 1/100th of a °C). Economic Suicide (all pain, no gain)! More discussion on these topics can be found in my PSS-6 – Climate Change – Quick Cost/Benefit Analysis and OPPS-32 – Liberal – Net Zero – Cost Benefit posts. The subjects have also been addressed in the book “Energy & Climate at a Glance – Canadian Edition 2024” (available from the Friends of Science Society) and a discussion piece I put together prior to the recent Canadian election, “In What Reality Does Net Zero Make Sense?”.


CSS-59 – Calgary Temperatures – Revisited


For more perspective and more detailed analysis, you can also check out some of the following posts.
Energy & Climate at a Glance – Canadian Edition 2024
Net Zero Averted Temperature Increase – Lindzen, Happer, van Wijngaarden (June 2024)
https://arxiv.org/abs/2406.07392
In What Reality Does Net Zero Make Sense?
Climate Short Story (CSS)
CSS-19 – Calgary Homogenization
CSS-59 – Calgary Temperatures – Revisited
One Page Summary (OPS)
OPPS-32 – Liberal – Net Zero – Cost Benefit
One Page Summary (OPS)
OPS-55 – The State of Climate Science
Political Short Story (PSS)
PSS-6 – Climate Change – Quick Cost Benefit Analysis


