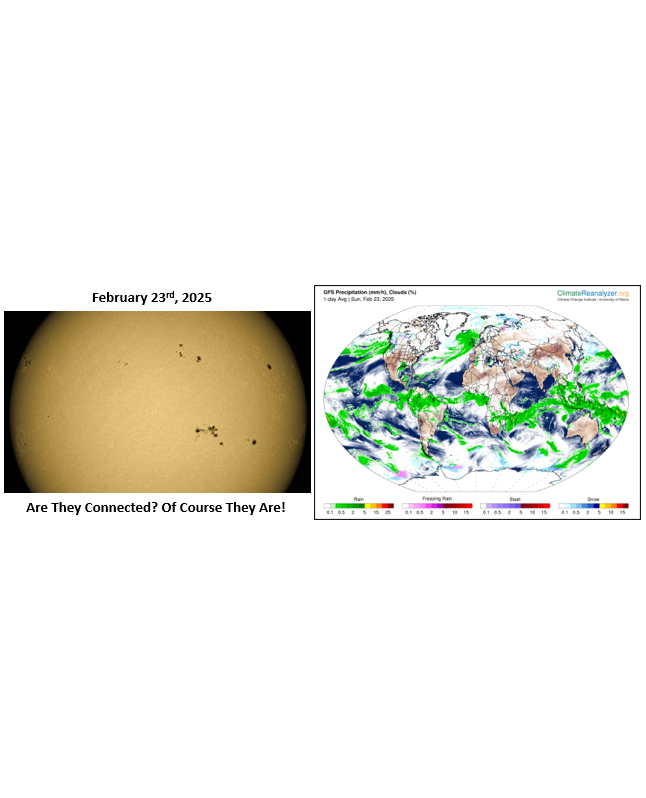
Are Hurricanes Just Earthspots?
CSS-66 This post has a quick look at sunspots and hurricanes (which could be described as “earthspots”). There are a lot of similarities between the two phenomena despite being subject to very different circumstances. The sun is composed of plasma (super-hot ionized gas) while the earth is a mixture of solids (land/ice masses), liquids (oceans/lakes) and gases (atmosphere). Both systems are complicated and interactive. And both systems are connected through gravitational, electromagnetic, and particle/solid interactions. There is a direct correlation between hurricane/cyclone activity and sunspot number. When sunpot numbers are high, the number of strong hurricanes/cyclones (94+ knots) is low and vice versa.
#climatechange #delaythegreen #globalwarming #showusthedata
The similarities are interesting. There are five categories summarized below.
- The Same Field Structure (electromagnetic fields surround both the earth and the sun).
- Sunspots and Tropical Storms both develop in the mid-latitudes with no equatorial crossovers.
- Sunspots and Tropical Storms have similar shapes (umbra/penumbra) and energy development.
- Sunspots and Tropical Storms connections (electric circuit connections, plasma/high energy particle eruptions.
- Sunspots and Earthspot pulses (1-to-3-minute visible pulsing).
The earth and the sun are connected through the electromagnetic fields present throughout the solar system. That connection/correlation is very visible in the sunspot and hurricane/cyclone frequency data. What does not appear in the hurricane/cyclone data? A correlation with CO2. As CO2 has risen, global hurricane activity has been declining. CO2 is not causing extreme weather (cyclonic or otherwise) to worsen (in quantity or magnitude) based on the empirical data (CSS-52 – Extreme Weather Events) or in the IPCC’s scientific analysis (CSS-64 – IPCC – Chapter 12 – Extreme Weather). The ‘‘climate change’ is increasing extreme weather’ narrative is a fabrication of the NGOs/Marxists running the IPCC, the ideological politicians controlling our governments and their media/academic minions. The attribution studies that are now routinely used to attribute some percentage of every extreme weather event to ‘climate change’ is just an extension of that fabrication. Those attribution studies are still using the same computer models that are self-acknowledged to “run way too hot” and are still using implausibly high emission scenarios (i.e.: any scenarios above ssp2-4.5). Garbage In/Garbage Out (GIGO)!
”Earthspots” are just a discussion point but the connections are real and the interplay between the sun and earthspots should be investigated further, Will that happen in the current Net Zero/energy transition quagmire? Not likely, and not soon enough. Note, we do not have to start calling hurricanes earthspots, but their electromagnetic connections do play a role in our climate. This post shows the hurricane/sunspot/TSI correlation but there are other direct earth-sun connections. Solar flares release energy and if that energy is directed at earth, they can and do impact our climate within minutes. The same goes for Coronal Mass Ejections (CMEs) but with a longer delay. Solar Flares/CMEs likely played roles in the anonymously high temperatures recorded in 1859 (the Carrington event), 1921 (The Hottest Year in US History), and 2012 (The Hottest Climate Change Stories of 2012). All years with major solar flare/CME events. A more in-depth discussion (Forbush Events, Cosmic Ray Flux, electromagnetic field strength, etc.) can be found in my CSS-36 – Solar Flares and CMEs post.
The real existential threat to our planet is the sun, not CO2. The sun can and will generate much stronger flares/CMEs than we have become accustomed to. Combined with the planet’s weakening magnetic field protection, our electrical grids are at severe risk. We need to stop worrying about and wasting trillions of taxpayer’s dollars on a small change in a trace gas in our atmosphere (i.e.: CO2). Our number one focus should be hardening our electrical grid to survive the next inevitable major solar flare/CME event we will experience.
We were lucky that the 2003 X45 and 2012 X50 flares were not aimed at the earth. And more recently (March 12th, 2023), a “Massive Solar Eruption…” released a “rare, high-speed CME” (“traveling at an unusually fast 2,127 kilometers (1,321 miles) per second”). This large X class flare (magnitude undetermined) erupted just after I posted OPPS-20 – Why Are We Putting All Our Eggs in One Basket? Note, the March 2023 solar flare and increased solar activity we are experiencing as we approach Solar Cycle 25’s maximum, very likely contributed to the unusually high temperatures of 2023 and 2024. Other contributing factors are the 2023 El Niño, the Hunga-Tonga volcanic eruption (massive stratospheric water injection) and improved ocean shipping emission standards (fewer aerosols). CO2 contributions to the roughly 1.0 °C temperature rise over 2023 would have been undetectable.


OPS-62 – Weakening Electromagnetic Field/Solar Winds


Global Tropical Cyclone Activity – Dr. Ryan N. Maue
For more perspective and more detailed analysis, you can also check out some of the following posts.
Earth Spots – The Most Obvious Ignored Science
What Are the Finger-Like Clouds in the Hurricane Inner Core Region?
https://agupubs.onlinelibrary.wiley.com/doi/full/10.1029/2024GL110810
Does Solar Activity Cause Stronger Hurricanes – Climate Science Journal – Ryan Maue
Global Tropical Cyclone Activity – Dr. Ryan N. Maue
https://climatlas.com/tropical
The Stable Climate of 1859 – Tony Heller
1921 The Hottest Year in US History – Tony Heller
The Hottest Climate Change Stories of 2012 – Live Science
https://www.livescience.com/25789-hottest-climate-change-2012.html
Massive Solar Eruption Blasts NASA Probe Head On Before Impacting Earth – NASA
https://scitechdaily.com/massive-solar-eruption-blasts-nasa-probe-head-on-before-impacting-earth
Climate Short Story (CSS)
CSS-36 – Solar Flares and CMEs
CSS-52 – Extreme Weather Events
CSS-64 – IPCC – Chapter 12 – Extreme Weather
One Page Political Summary (OPPS)
OPPS-20 – Why Are We Putting All Our Eggs in One Basket?
One Page Summary (OPS)
OPS-55 – The State of Climate Science
OPS-62 – Weakening Electromagnetic Fields/Solar Winds


