UAH – July 2024 Update – Recent Heat
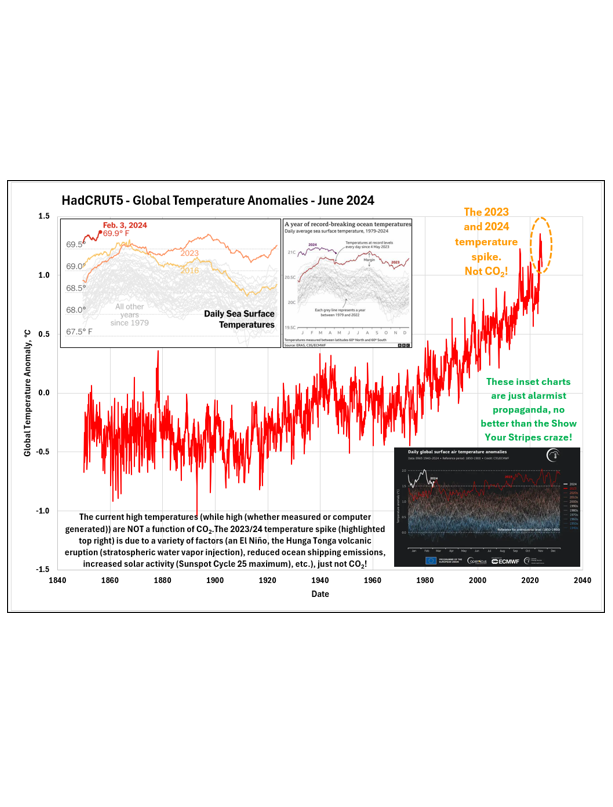
CSS-60 The alarmist community has been making a lot of hay out of the current highest temperatures EVER. While the temperatures are indeed high, the narrative being pushed (as usual) lacks proper context. The temperature spike (not a climate trend) that produced these high temperatures took roughly 15 months (based on the UAH Lower Troposphere Satellite dataset) to increase the temperature anomaly from -0.04 °C to 1.05 °C. That 1.09 °C increase is not due to CO2, period! The temperature increase is due to a combination of factors (an El Niño, the Hunga Tonga volcanic eruption (stratospheric water vapor injection), reduced ocean shipping emissions, increased solar activity (Sunspot Cycle 25 maximum), etc.), just not CO2!
#climatechange #delaythegreen #globalwarming #showusthedata
This post focuses on the University of Alabama, Huntsville Lower Troposphere satellite temperature data. But that same temperature spike also exists in the various surface temperature datasets. Based on past experience (the disappearing Dirty 30s and missing, late 19th century heat, and historically reduced El Niño spikes), the homogenization process will likely reduce this temperature spike in the future. We would not want this to be the last Hottest Year EVER! Unfortunately for the alarmist community, the recent high temperatures will begin to drop off as the mechanisms responsible begin to weaken, despite rising CO2 levels.
The basic premise of the alarmists’ All CO2, All the Time narrative espouses that human activity (primarily CO2 emissions) is responsible for the vast majority of ‘Climate Change’. Those alarmist proponents (including politicians, media and “scientific” organizations like the UN-IPCC and the WEF) are happy to tie the current high temperatures to ‘Climate Change’ (i.e.: CO2). You cannot get much more ideological and unscientific than that. For these temperatures to be related to CO2 concentrations/emissions, the datasets (at a minimum) must be correlated. But there are no scenarios where CO2 can be realistically correlated to the current high temperatures. This post presents the range of unrealistic correlations that are possible. Anyone that says these current temperatures are due to ‘Climate Change’ is buying into one of these ridiculous correlations.
There are essentially three scenarios that honour the 2023 and 2024 high temperatures (none of which show a CO2/temperature correlation).
- Superimposing the full CO2-UAH Temperature data fit over the 2023/24 data points.
- Honouring the early data (December 1978 to December 1991) and the 2023/24 data points.
- Honouring just the last 3.5 years (2021-01 to 2024-07).
Ironically, the alarmist community is already using a CO2/Temperature correlation like Option #3 above. The All CO2, All the Time alarmist narrative posits that the 1.07 °C warming since the pre-industrial era is due to anthropogenic influences (primarily CO2’s 140 ppm increase). CO2 does correlate loosely with Global Temperature over this period (1850 to the present). But remembering that context is important, this is the right time to remind everyone that the 1850 to the present period also correlates (better than CO2) with solar activity. That discussion can be found in my CSS-42 – The Role of the Sun – Scafetta 2023 and CSS-51 – Soon-Connolly – Solar Forcings posts.

The focus on 1850 to the present ignores the temperature changes present throughout the pre-1850 Holocene interglacial warm period. Temperatures fluctuated significantly throughout the pre-1850 Holocene’s 11,000+ years despite a virtually flat CO2 concentration. There is certainly no CO2/Temperature correlation pre-1850. Yet somehow temperatures change without the CO2 influence programmed into the IPCC’s Computer models. Those same models that are self-acknowledged to “run way too hot” and use unrealistically high emission scenarios. CO2 and temperature only correlate with the last 174 years (1.5%) of the Holocene’s ±11,300 years. Natural forcings (primarily solar (directly and indirectly)) are responsible for the pre-1850 temperature fluctuations. Those natural forcings were still active post-1850 and will continue to be active in the future (just not in the virtual reality world created by the computer models).
The same analysis can be applied to the Canadian forest fire data. Canada’s 2023 fire season was huge (a record 18.5 Mha burnt) but the 18.5 Mha is an anomaly not a trend (review my OPPS-27 – A Single Event is NOT a Trend post). Canadian forest fire statistics have been statistically flat since 1980 and right up until the end of 2022. Meaning ‘Climate Change’ (i.e.: CO2) has not had a statistically significant impact on acreage burnt. This post only includes the superposition correlation between CO2 and acreage burnt. As shown, the superposition correlation is ridiculous. The other two correlation options would be just as ridiculous. Anyone claiming that Canada’s 2023 acreage burnt is due to CO2 is either willfully or inadvertently endorsing one of these obviously incorrect correlations. Current acreage burnt (2024) is 2.9 Mha, slightly below the average over the last ten years.
To summarize, the alarmist community is continuing to cherry pick data, while ignoring the Scientific Method and relevant/inconvenient data. The simplistic, unscientific All CO2, All the Time narrative must be preserved.


CSS-51 – Soon-Connolly – Solar Forcings

For more perspective and more detailed analysis, you can also check out some of the following posts.
Climate Short Story (CSS)
CSS-32 – UAH-LT Temperature – November 2022
CSS-42 – The Role of the Sun – Scaffeta 2023
CSS-51 – Soon-Connolly – Solar Forcings
One Page Political Summary (OPPS)
OPPS-27 – A Single Event is NOT a Trend
https://climatechangeandmusic.com/a-single-event-is-not-a-trend/


Oh my goodness! Awesome article dude! Thank you, However I am encountering troubles with your RSS. I don’t know why I am unable to join it. Is there anyone else having identical RSS issues? Anyone that knows the solution can you kindly respond? Thanx!!
You ought to be a part of a contest for one of the highest quality blogs on the internet. I will recommend this site!
I truly love your website.. Very nice colors & theme. Did you develop this site yourself? Please reply back as I’m hoping to create my own website and want to know where you got this from or what the theme is called. Thank you!
This site really has all of the info I wanted concerning this subject and didn’t know who to ask.
Hello there! I could have sworn I’ve been to this site before but after browsing through a few of the articles I realized it’s new to me. Anyways, I’m certainly delighted I stumbled upon it and I’ll be bookmarking it and checking back often!
An interesting discussion is definitely worth comment. There’s no doubt that that you should publish more on this topic, it might not be a taboo matter but typically people don’t discuss these subjects. To the next! Cheers!!
You are so awesome! I don’t suppose I’ve truly read through something like this before. So wonderful to discover another person with a few genuine thoughts on this issue. Seriously.. thanks for starting this up. This website is something that is needed on the internet, someone with some originality!